Echelon Report 018 Special Edition | November 2, 2026
Finding
National search interest for roof replacement rose 9.6% from the previous week and 23.9% from the same week last year. Roof repair rose 10.3% and 14.3% on those same comparisons. Before adding lead spend, a roofing owner can compare that national movement with qualified local inquiries, completed estimates and the contribution expected from accepted jobs.[1]
The search week is October 25–31, compared with October 18–24 and October 26–November 1, 2025. Each percentage describes movement within one national search phrase, not local customer volume. Incomplete November 1–2 readings are excluded.[1]
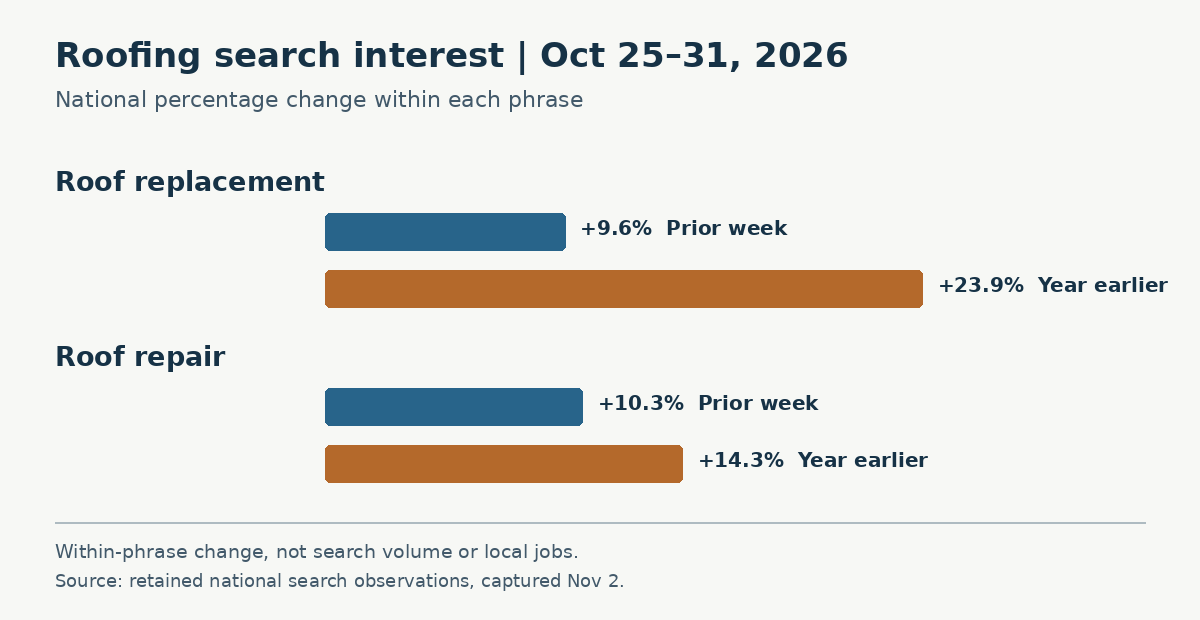
National changes within each phrase. The bars do not compare search volume across services. Source: retained search observations captured November 2.[1]
Dated evidence table
These are normalized search-interest readings on each phrase’s own scale. A reading of 93 for one phrase cannot be compared with 57 for another. The percentage columns compare each row only with its own earlier observations.[1]
Ten core services
| Service | Oct 25–31 | Oct 18–24 | Oct 26–Nov 1, 2025 | Week change | Year change |
|---|---|---|---|---|---|
| ac repair | 36 | 33 | 31 | +9.1% | +16.1% |
| bathroom remodel | 73 | 70 | 77 | +4.3% | -5.2% |
| foundation repair | 42 | 46 | 42 | -8.7% | +0.0% |
| furnace repair | 53 | 50 | 51 | +6.0% | +3.9% |
| hvac replacement | 32 | 33 | 30 | -3.0% | +6.7% |
| kitchen remodel | 61 | 59 | 64 | +3.4% | -4.7% |
| roof repair | 64 | 58 | 56 | +10.3% | +14.3% |
| roof replacement | 57 | 52 | 46 | +9.6% | +23.9% |
| water heater replacement | 29 | 28 | 23 | +3.6% | +26.1% |
| window replacement | 42 | 44 | 44 | -4.5% | -4.5% |
Four additional door services
| Service | Oct 25–31 | Oct 18–24 | Oct 26–Nov 1, 2025 | Week change | Year change |
|---|---|---|---|---|---|
| door replacement | 42 | 41 | 37 | +2.4% | +13.5% |
| entry door replacement | 23 | 19 | 58 | +21.1% | -60.3% |
| storm door installation | 93 | 55 | 65 | +69.1% | +43.1% |
| storm door replacement | 47 | 47 | 38 | +0.0% | +23.7% |
Window replacement appears once in the core table. The four door phrases are separate service coverage, not additions to the index basket.[1]
What the search changes mean for an owner
Roof replacement read 57 for October 25–31, up from 52 the prior week and 46 a year earlier, yet below its own preceding 52-week median of 68. Before shifting acquisition spending in response to a national search change, check whether inquiries arrive from serviceable ZIP codes, how quickly estimates reach those customers and whether accepted jobs contribute enough for the crew time required. Local demand and national interest can move in different directions.[1]
Door work offers another useful check. Storm door installation rose 69.1% in the week and 43.1% against the year-earlier week. Entry door replacement rose 21.1% in the week, yet was 60.3% below its year-earlier reading. A window-and-door owner should separate installation and replacement inquiries rather than treat every door call alike.[1]
September’s existing-home sales rate was 3.99 million at a seasonally adjusted annual rate, according to the October 13 release.[2] September building permits were 1,398 thousand housing units at an annualized rate.[3] The October 29 observation for the 30-year fixed mortgage rate was 7.24%.[4] These dated national figures supply housing context; they do not explain the week’s roofing searches.
Owner decision
For the two complete operating weeks after the November 2 edition, compare inquiries with the preceding equal-length period in your territory, using the same service categories and noting available crew capacity. Record each request’s service, ZIP code, source, received date, first response, estimate date, quoted amount, disposition and expected direct labor and materials. Include declined work and the reason, especially when the requested start date or expected margin made it unattractive. Twice a week, have the office lead and estimator review open estimates, including requests still awaiting a customer decision. Note changes in territory, offers, advertising and local weather.
| What the local log shows | Next move | Measure | Continue, revise or stop |
|---|---|---|---|
| More replacement inquiries and timely estimates | Test a small shift within the approved marketing budget | Accepted jobs and expected contribution after direct costs and added lead spend | Continue if contribution, cash capacity and delivery dates meet the owner’s thresholds |
| More inquiries but slow estimates | Clear the estimate queue before buying leads | Days to estimate, acceptance and contribution by job type | Revise follow-up; stop added acquisition if the queue grows |
| National interest up, local qualified inquiries flat | Check calls, forms, territory and offer fit | Qualified local inquiries and accepted work per channel dollar | Hold spend until the local log supports a test |
| More accepted jobs than crews can deliver | Protect promised start dates and screen low-margin work | Expected contribution per crew-day and near-term cash needs | Stop expansion that displaces profitable committed work |
For an accepted estimate, expected contribution is quoted revenue minus direct labor, materials, subcontractors and variable acquisition cost. Compare total expected contribution from accepted jobs with the preceding equal-length period. Keep spend, service mix and crew-days beside the totals. Lead volume alone is not the test.
Scope method source notes
The search readings are national, single-phrase normalized series. The ten core services are listed above; four door services are supplemental. Search interest is not a count of searches, leads, booked jobs or sales. The matched review-count component lacks a usable current observation for one business in its fixed panel. The six-component index remains on hold; this edition does not calculate or publish a substitute score.[1]
The housing figures describe September activity. The mortgage observation is dated October 29. Weather was not used to explain the October 25–31 search movement: the latest complete ten-station weather week was October 18–24, one week earlier.[2][3][4][5]
Editorial revision November 3, 2026. Figures and source observations retain the dates stated in this edition.
Sources
- [1] National search interest, Google Trends
- [2] National Association of Realtors, September existing-home sales
- [3] FRED, building permits (PERMIT)
- [4] FRED, 30-year mortgage rate (MORTGAGE30US)
- [5] NOAA, GHCN daily station archive
Relevant next step
If your log identifies a service or ZIP-code gap, email Mike with the service, target ZIP codes, competing offers, crew constraint and contribution threshold. Echelon can discuss a scoped local market check before you change the offer or budget.