
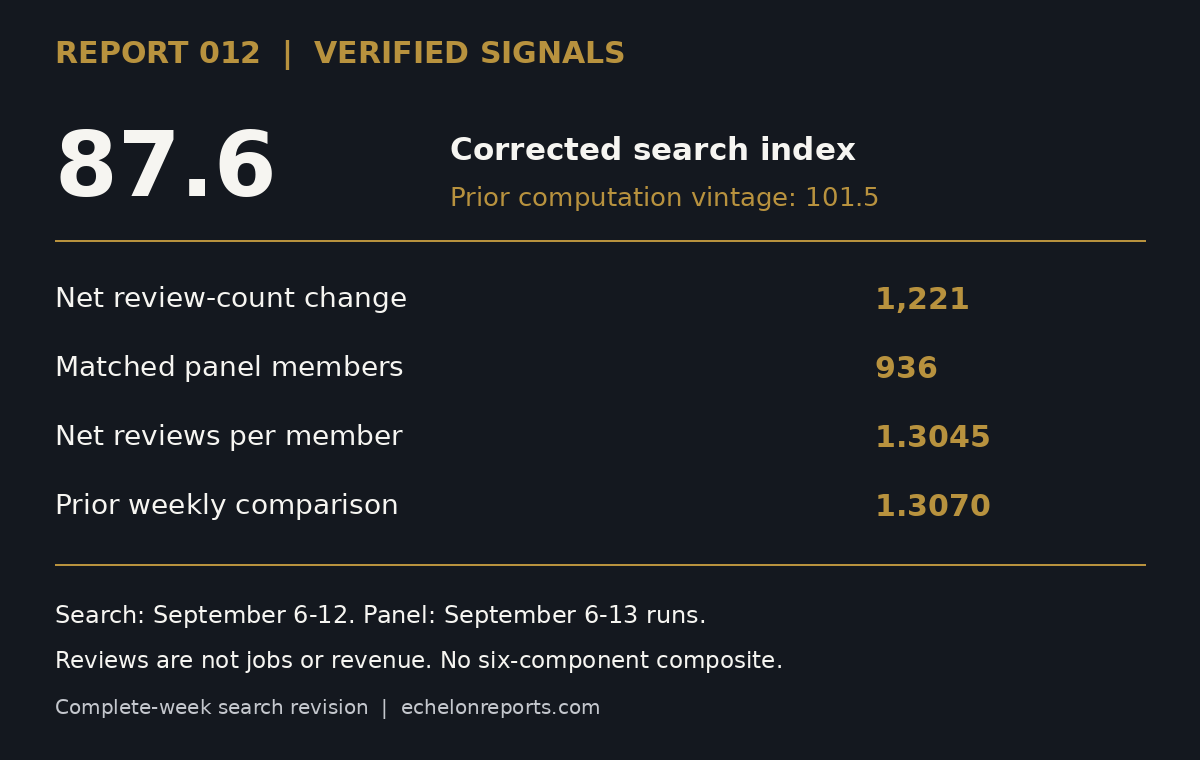
Residential-trades search interest weakened in the latest complete week, while observed review growth across Echelon’s contractor panel was nearly flat. The corrected search index is 87.6, down from 101.5 for the preceding archived pull calculated under the same corrected method. Net review-count growth averaged 1.3045 per matched member, compared with 1.3070 in the prior weekly comparison.
The read: these signals do not establish a broad recovery in residential trades demand. They give operators a reason to watch incoming work closely, not a reason to assume every local market is contracting.
This delayed Report 012 uses evidence collected by September 13, 2026. Its original archive label was “week ending September 19.” That was an edition label, not an observation cutoff. This edition does not issue a six-component ERDI headline. The correction and exclusions are explained below.
What changed in residential-trades demand?
The ten-keyword search basket averaged 54.4 for September 6–12, compared with 62.9 for August 30–September 5 within the same September 13 data pull. That is a 13.5% decline in the normalized basket, not a measured 13.5% decline in searches, leads, or booked work.
The corrected index compares that basket with its preceding 52 complete weekly observations. It reads 87.6, with 100 representing the basket’s median baseline. The corresponding calculation from the September 6 archived pull reads 101.5. Because Google Trends rescales its data, comparisons between pulls can include changes to historical values. The same-pull comparison above confirms that the latest week’s basket was also lower within a single observation window.
DataForSEO supplies the Google Trends series used here. Its normalized readings measure relative search interest, not absolute customer demand.[4]
The verified signals
| Signal | Latest reviewed evidence | Comparison | What it establishes |
|---|---|---|---|
| Corrected search index | 87.6; September 6–12 observations | 101.5 from the preceding archived pull, recalculated under the same method | Search interest weakened; source rescaling can affect the size of the change between pulls |
| Search basket within one pull | 54.4 | 62.9 for the preceding week | A 13.5% decrease in the normalized basket within the September 13 pull |
| Net review-count growth per matched member | 1.3045 | 1.3070 in the prior weekly comparison | Nearly flat observed review growth, not an increase in job volume |
| Latest complete weather index | 130.6; August 30–September 5 | Baseline 100; three prior-year weekly observations | Elevated thermal stress in an older, complete window; no new week-over-week weather claim |
Source: retained Echelon source responses and panel observations. Search values use the corrected complete-week calculation. Weather and panel windows differ from the search window.
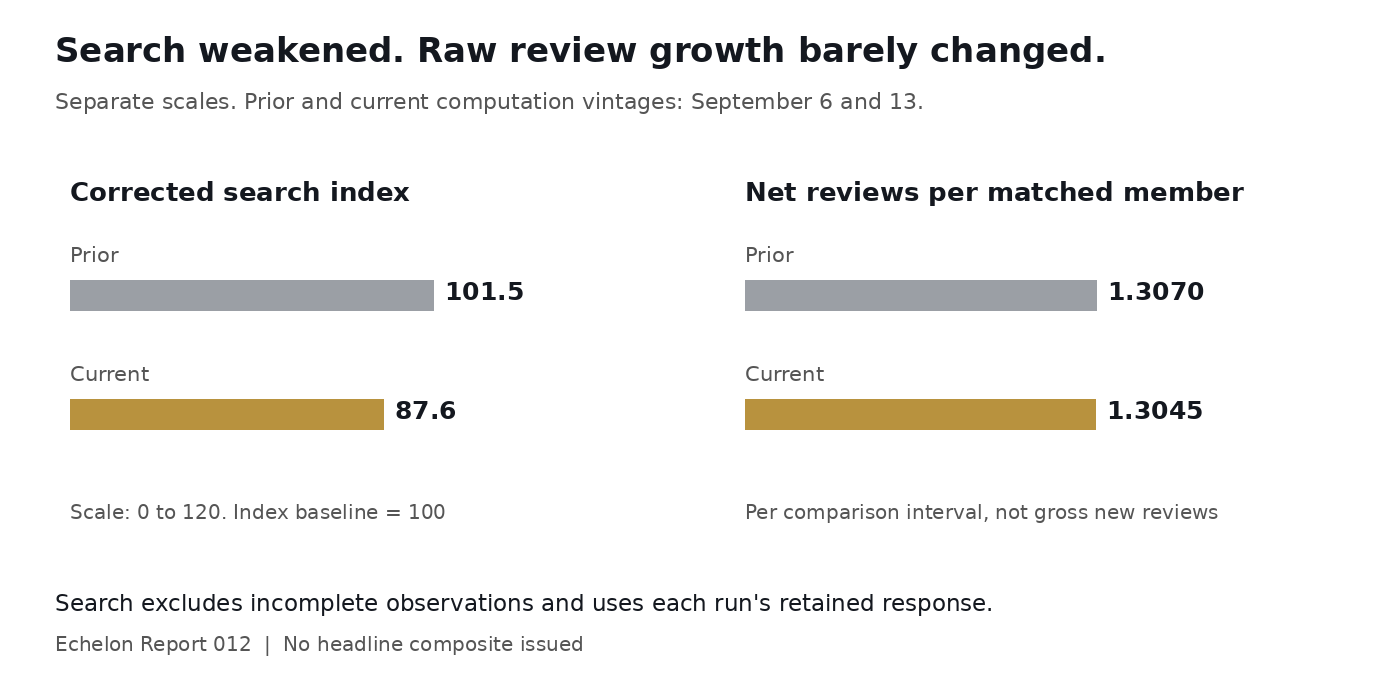
The chart compares September 6 and September 13 computation vintages. The search and review panels use different scales and units.
Review activity held flat, despite a higher panel index
The September 13 panel run recorded a net increase of 1,221 reviews across 936 matched members against the September 6 run. Positive count changes totaled 1,344, offset by 123 in negative changes. These are net changes in observed cumulative counts, not a count of every newly posted review.
The resulting average was 1.3045 per member, slightly below the prior comparison’s 1.3070 across 938 matched members. The matched membership differs between comparisons, so the small difference should not be read as a precise same-company change in activity.
The archived panel index nevertheless rose from 80.4 to 81.8. Why? Its moving median baseline fell from 1.6265 to 1.5939. A lower denominator lifted the index even though raw review growth per matched member did not rise.
The read: review activity was essentially flat. The higher panel index is not evidence of rising completed-job volume. Review-request practices, platform timing, and removals can affect these counts alongside actual work. Reviews are not booked jobs, revenue, unique companies, or workers.
Weather is elevated, but the window matters
The latest complete weather window available in the reviewed evidence is August 30 through September 5. All ten tracked stations have seven days of observations, for 70 station-days. The resulting weather index is 130.6 against its historical baseline.
The following week’s retained data contain only 50 station-days, covering September 6–10. September 11 and 12 are missing. That partial week is excluded rather than presented as a complete observation.
The weather signal derives thermal stress from station temperature readings. NOAA’s daily station records provide the underlying maximum and minimum temperature observations.[5] The complete window’s reading does not establish weather conditions through September 12 or September 19, and it does not count service calls.
The read: the older weather reading cannot confirm a demand recovery in the newer search window. Use local weather, call volume, and dispatch records to establish whether service urgency is increasing in a particular market.
Why Report 012 has no headline ERDI number
The prepublication review found that the search calculation retained incomplete observations alongside complete weeks. We rebuilt the search component from each edition’s retained source response, excluding incomplete periods and requiring ten keywords across 52 consecutive complete baseline weeks plus the current week.
The corrected search figures are 87.6 for the September 13 pull and 101.5 for the September 6 pull. For search-component comparison, 101.5 supersedes the 92.7 shown in Report 011.[6] It is not a restatement of Report 011’s full composite.
The housing-turnover input also remains unverified against an independently recovered official response, and the available comparison baseline contains only one prior-year month. We exclude that component from this edition. Financing and permit levels are outside this narrowed review; no new values are claimed for them here.
The original 97.7 computation remains in Echelon’s historical archive, but it is not the validated headline for this edition. We have not replaced it with a five-component average or silently rewritten the old records. A revised full composite requires all six inputs to pass the same release standard.
What operators should watch next
Whether weaker search reaches the booking sheet
Compare qualified inquiries, estimates, booked jobs, and completed work by service category. A lower national search basket does not show whether one contractor lost visibility, whether callers failed to book, or whether a local market softened.
If inquiries fall while booking rates hold, investigate demand and visibility. If inquiries hold but bookings fall, inspect response time, pricing, and follow-up. Those situations call for different actions.
Whether review growth and operating records agree
The panel’s 1.3045 versus 1.3070 comparison gives little support for a claim that activity accelerated. Check the business’s completed-job count and review-request rate before treating a change in reviews as a change in revenue.
Another weak search observation paired with fewer completed jobs would strengthen the slowdown interpretation. A search rebound accompanied by stronger bookings would weaken it. Either conclusion needs local operating evidence.
The bottom line
Corrected search evidence weakened. Observed panel review growth was nearly flat. The complete weather reading covers an older window and cannot resolve the difference.
The evidence does not confirm a broad recovery. Keep spending and staffing decisions tied to profitable booked work, not to an unverified composite headline.
Methodology and limits
Search: ten US residential-trades terms, each drawn from the same archived DataForSEO pull for that edition: AC repair, furnace repair, roof replacement, roof repair, bathroom remodel, kitchen remodel, foundation repair, window replacement, water heater replacement, and HVAC replacement. The calculation rejects incomplete periods, requires Sunday-to-Saturday weeks and all ten keywords, and divides the current basket mean by the median of the preceding 52 consecutive complete weekly baskets. Each keyword series is separately normalized, so the basket is not weighted by actual search volume.[4]
Panel: changes in cumulative review counts between run-level observations on September 6 and September 13. The latest comparison matches 936 members. The current baseline is the median of ten prior available weekly velocities, not a fixed annual average. Individual requests occur during each run, so the run timestamp is not a precise observation time for every member. This is an observed panel, not a probability sample of all US contractors.
Weather: the daily average temperature across ten tracked stations is compared with 65°F; daily absolute departures are summed across a complete week. The baseline is the median of the nearest eligible complete weekly observation in each of the prior three years. This edition verifies the latest complete window’s level but does not claim a newly reconstructed prior-vintage weather comparison.[5]
The retained raw evidence supports this edition’s calculations. Live documentation links below explain the source systems; they do not necessarily display the historical values used here. This edition makes no claim about national license totals, license movement, business exits, hiring, or acquisitions. It is not a revenue forecast.
Put the weekly signals to work
The national report helps frame the demand question. Echelon’s market intelligence examines the businesses, competitors, licenses, and ownership records behind a specific commercial decision.
Commission a market intelligence report