
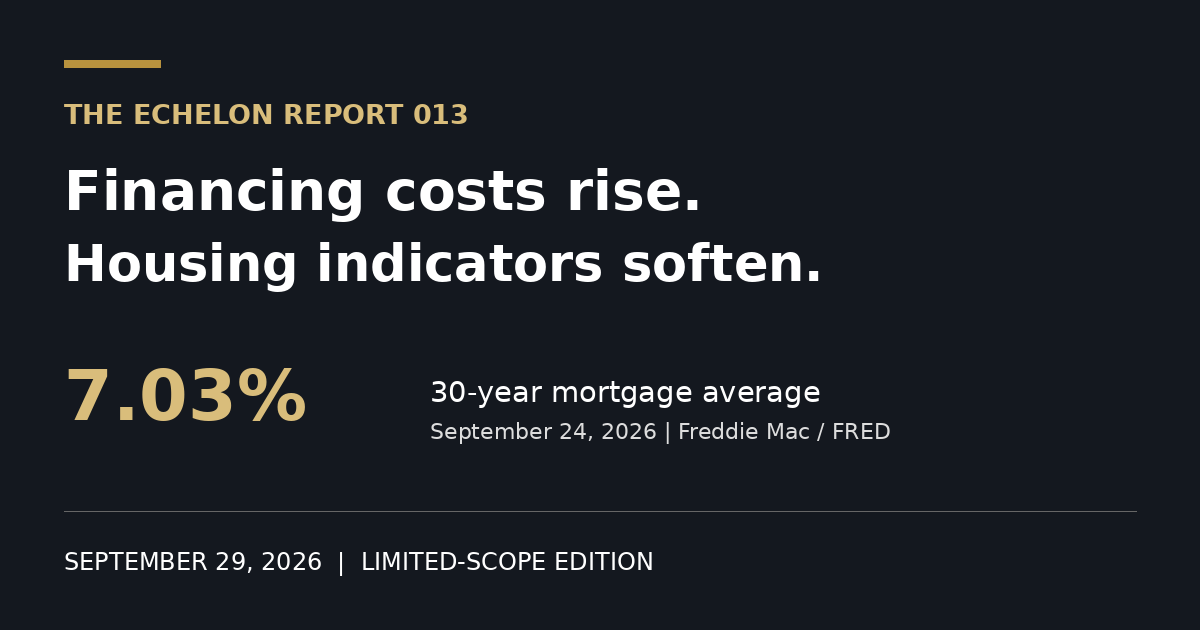
The average 30-year fixed mortgage rate reached 7.03% on September 24, up from 6.95% a week earlier. August housing permits and existing-home sales both fell from July. For contractors planning fall work, these national indicators support a cautious sales plan, not an assumption that cheaper financing will bring customers back.[1][2][3]
Week of September 28, 2026. Published September 29. Limited-scope edition. This report covers independently verified national housing indicators. It does not publish a new Echelon Residential Demand Index reading, a local market ranking, or license-movement findings. Those comparisons remain under review.
What changed
| Indicator | Latest observation | Prior observation | Change |
|---|---|---|---|
| Average 30-year fixed mortgage rate | 7.03%, September 24 | 6.95%, September 17 | Up 0.08 percentage point |
| Housing units authorized by building permits | 1.403 million annualized, August | 1.433 million annualized, July | Down 2.1% |
| Existing-home sales | 3.98 million annualized, August | 4.06 million annualized, July | Down 2.0% |
Sources: Freddie Mac, Census/HUD and the National Association of Realtors, retrieved through FRED on September 29. The mortgage rate is a weekly average. Permits and sales are monthly, seasonally adjusted annual rates. They are not the actual number of permits issued or homes sold during August.[1][2][3]
Financing is getting less favorable
The mortgage average rose from 6.71% on September 3 to 7.03% on September 24, an increase of 0.32 percentage point. The latest weekly increase was 0.08 percentage point, or eight basis points.[1]
Our read: Do not build a fall forecast around an imminent financing-driven surge in home purchases. A higher national mortgage average does not establish how many homeowners will request work from an individual contractor, but it gives little support to a forecast that assumes purchase financing has become easier.
For an operator, the useful test is closer to the customer: are estimates losing to price, financing, timing, or another contractor? Record the reason when a quoted job stalls. A falling close rate requires a different response from a falling inquiry count.
Permits and transactions point in the same direction
The permit series declined from an annualized 1.433 million housing units in July to 1.403 million in August. That is a 30,000-unit decline in the annualized rate, not 30,000 canceled projects. Permits authorize housing units; they do not measure completed construction or remodeling orders.[2]
Existing-home sales declined from an annualized 4.06 million in July to 3.98 million in August, a rounded 2.0% decrease.[3]
Our read: Builders and trades that rely on new housing or transaction-triggered projects should test their own pipeline against these softer national readings. The figures do not prove that demand for repair, replacement, accessibility work, or remodeling fell by the same amount. They also do not establish that homeowners who postpone moving will automatically spend more on improvements.
For an acquirer, this is a reason to separate a target’s work by source before accepting a single growth forecast. New-construction work, move-related projects, and service calls can respond differently. Request the target’s actual mix, booked backlog and cancellation history rather than treating a national housing figure as company revenue evidence.
What to check this week
Compare new inquiries, issued estimates and accepted jobs with the same measures in your own recent operating history. Keep the counting rules unchanged. Then look at the jobs that did not proceed and the reason each customer gave.
If the weakness is concentrated in discretionary projects, test a clearer scope or payment conversation before increasing advertising spend. If inquiries are stable but accepted work is falling, inspect the estimate and follow-up process. These are operating recommendations, not findings about any particular contractor.
Scope and methodology
This edition uses three public national series retrieved on September 29, 2026: Freddie Mac’s MORTGAGE30US, Census/HUD’s PERMIT and NAR’s EXHOSLUSM495S. The weekly and monthly observations have different dates and are shown separately. Percentage changes use the displayed prior observation as the denominator and are rounded to one decimal place. Rate changes are percentage-point differences.[1][2][3]
The figures are source observations, not scores from the Echelon Residential Demand Index. We are withholding a new index comparison because its historical inputs have not cleared verification. This limited edition does not repair, replace or extend the numerical index series. It makes no claim about statewide contractor totals, ownership transfers, local demand rankings or individual company performance.
Put these signals in your market context
National housing data cannot tell you which competitor is gaining ground in your market. An Echelon Intelligence Report examines a specific market and its operators, with the evidence and limitations stated alongside the findings.
Sources
- 1. MORTGAGE30US
- 2. PERMIT
- 3. EXHOSLUSM495S