Finding
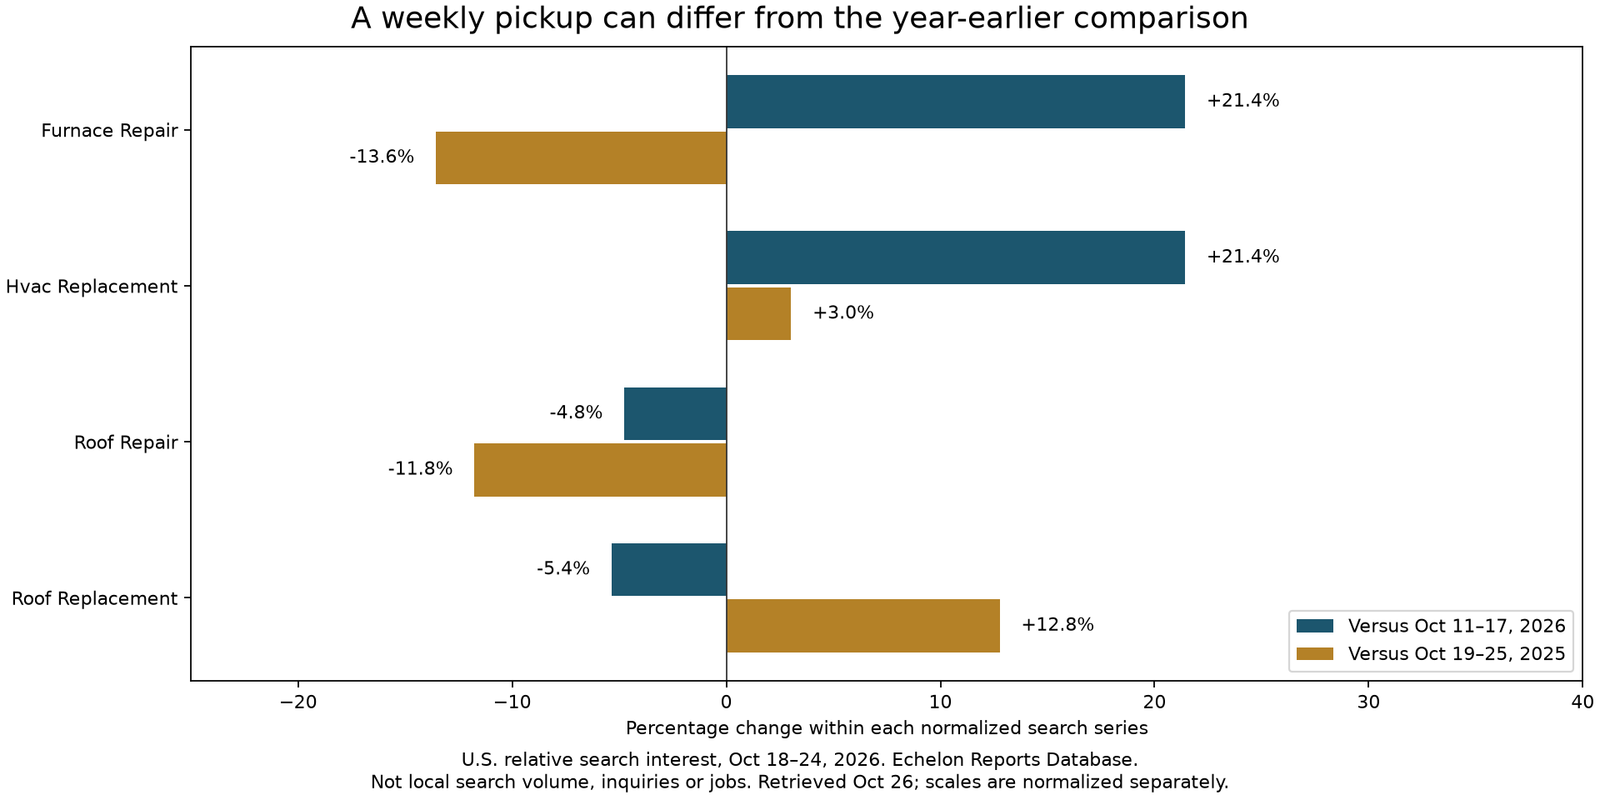
What changed since the last measurement: eight of the ten core service phrases gained national search interest during October 18–24. Furnace repair rose 21.4% from the preceding week, while HVAC replacement also rose 21.4%. Their year-earlier comparisons differed: furnace repair remained 13.6% lower, while HVAC replacement was 3.0% higher. These are Echelon Reports Database readings of relative search interest, not counts of customers or jobs.
For an HVAC owner, the useful decision is to separate repair inquiries from replacement inquiries before changing the offer. A shared weekly increase does not mean the two services have the same opportunity, customer economics or crew requirements. Check which inquiries become suitable appointments and profitable estimates before increasing spending or cutting prices.
Dated evidence table
National search-interest changes, October 18–24. Each service is compared with itself.
- Furnace repair
- Weekly +21.4%; year-earlier -13.6%.
- HVAC replacement
- Weekly +21.4%; year-earlier +3.0%.
- Roof repair
- Weekly -4.8%; year-earlier -11.8%.
- Roof replacement
- Weekly -5.4%; year-earlier +12.8%.
Ten core services
Each row uses its own normalized 0–100 scale. Read across a row, not down the column. A larger score for one phrase does not establish more searches than another phrase. The comparisons below use the October 26 retrieval throughout, because a fresh retrieval can rescale earlier readings.
| Service phrase | Oct 18–24 | Oct 11–17 | Oct 19–25, 2025 | Weekly change | Year-earlier change |
|---|---|---|---|---|---|
| ac repair | 34 | 32 | 37 | +6.2% | -8.1% |
| bathroom remodel | 73 | 63 | 87 | +15.9% | -16.1% |
| foundation repair | 49 | 36 | 51 | +36.1% | -3.9% |
| furnace repair | 51 | 42 | 59 | +21.4% | -13.6% |
| hvac replacement | 34 | 28 | 33 | +21.4% | +3.0% |
| kitchen remodel | 69 | 63 | 81 | +9.5% | -14.8% |
| roof repair | 60 | 63 | 68 | -4.8% | -11.8% |
| roof replacement | 53 | 56 | 47 | -5.4% | +12.8% |
| water heater replacement | 28 | 26 | 27 | +7.7% | +3.7% |
| window replacement | 46 | 43 | 49 | +7.0% | -6.1% |
Source: Echelon Reports Database. U.S. web-search interest, retrieved October 26, 2026. The year-earlier comparison is exactly 52 weeks earlier. National relative interest does not establish local demand, lead quality or advertising cost.
Four door services, outside the index
All four supplemental door phrases increased from the preceding week. Entry-door replacement rose 27.8%, but remained 62.3% below its year-earlier reading. Storm-door replacement rose 4.8% for the week and 7.3% against the year-earlier week. Those differences are a reason to keep service-specific records, not to treat doors as one uniform market.
| Service phrase | Oct 18–24 | Oct 11–17 | Oct 19–25, 2025 | Weekly change | Year-earlier change |
|---|---|---|---|---|---|
| door replacement | 42 | 41 | 42 | +2.4% | +0.0% |
| entry door replacement | 23 | 18 | 61 | +27.8% | -62.3% |
| storm door installation | 64 | 48 | 83 | +33.3% | -22.9% |
| storm door replacement | 44 | 42 | 41 | +4.8% | +7.3% |
Window replacement stays in the original index basket. The four door phrases remain separate coverage and do not alter the composite. Small normalized readings can produce large percentage changes; they do not establish the number of prospective customers in a contractor’s territory.
Analysis and counterargument
Our analytical read is that HVAC owners should investigate the difference between repair and replacement interest before adopting a broad promotion. The two phrases moved together this week, but their comparisons with the corresponding 2025 week point in different directions. An owner offering both services needs to know whether inquiries differ in suitability, appointment availability and expected contribution after direct costs.
The strongest counterargument is geographic: national searches can move differently from a local service territory. Weather, homeowner research and changes in search behavior may influence the readings, and this evidence does not identify a cause. The weather component covers October 11–17, an earlier week than the search comparison, so it does not establish a weather explanation for this week’s rebound.
A competitor may respond with a lower advertised price, quicker appointments or more prominent financing. Matching a discount without reviewing the reason customers decline an estimate could reduce margin without addressing the obstacle. Treat those potential responses as planning assumptions, not observations of a named competitor.
Roofing also shows why a broad rebound is an incomplete description. Both roofing phrases declined from the preceding week. Roof replacement remained 12.8% above the year-earlier week, while roof repair was 11.8% below it. Owners should use their own service mix when interpreting the national basket.
Owner decision
Run a two-week inquiry and estimate review from October 26 through November 8, with repair and replacement recorded separately. Compare that period with the preceding two weeks using the same definition of a suitable inquiry: work the business offers, inside its territory, with a realistic opportunity to serve the customer. Keep spending and the offer stable while identifying the main constraint.
The owner, dispatcher and marketing manager need the inquiry log, estimate outcomes, appointment calendar and direct job-cost estimates. Record the requested service, broad location, source, response time, appointment outcome and stated objection. Keep customer details in the business’s private systems.
| Observed constraint | First action | Measurement | Continue, revise or stop |
|---|---|---|---|
| Suitable repair inquiries do not become appointments | Review response delays and what the request page promises | Suitable inquiries, response time and appointments | Revise a repeated obstacle; do not assume a discount is the answer |
| Replacement estimates stall | Compare stated objections with scope, payment information and scheduling | Estimates, accepted work and reasons for declining | Improve the explanation where records support it; retain unknown reasons |
| Bookings exceed available capacity | Reconcile crew availability before expanding promotion | Promised dates, backlog and cancellations | Stop expansion that displaces better work or creates unrealistic commitments |
| Suitable bookings fit capacity and cover costs | Preserve the productive approach | Booked contribution and completed collections | Continue while economics hold; revise if contribution falls |
Contribution worksheet
Contribution is the amount left after direct job and acquisition costs, before general overhead. Use the business’s actual prices and costs rather than an assumed industry ticket. Expected booked sales are not collected cash; reconcile them after completion.
| Record for each service | Repair | Replacement |
|---|---|---|
| Suitable inquiries | ____ | ____ |
| Appointments and estimates | ____ | ____ |
| Jobs booked | ____ | ____ |
| Expected booked sales | ____ | ____ |
| Direct labor, material and subcontract costs | ____ | ____ |
| Attributable acquisition and handling costs | ____ | ____ |
| Expected sales minus both cost rows | ____ | ____ |
| Crew capacity for promised dates | ____ | ____ |
This recommendation requires staff time and consistent records, not an additional advertising budget. If a later expansion test is undertaken, stop when expected sales no longer cover direct job, acquisition and handling costs, or when the work exceeds available capacity. Set any additional required contribution floor using the business’s own overhead and profit needs. This is an analytical test, not guaranteed profit. A small sample remains inconclusive and does not establish improved conversion.
Next observation
At the November 9 review, compare suitable inquiries, appointments, estimates, bookings and contribution by service. Check whether the national furnace and replacement comparisons persist, but let the business’s results govern spending. If inquiries rise without suitable bookings, investigate the request and estimate process before purchasing additional traffic.
Scope method source notes
The complete six-component calculation is 93.6 against its component-specific references. That is a descriptive composite, not a forecast of jobs or revenue. Each component receives one-sixth weight. Values below 100 mean below the stated reference, not necessarily a decline from the preceding edition.
| Component | Index | Observation | Reference |
|---|---|---|---|
| Search interest | 78.2 | Oct 18–24 | Preceding 52 complete weekly basket readings, median |
| Existing-home turnover | 100.9 | September 2026 | Original September 2023–2025 releases, mean |
| New-housing permits | 95.6 | September 2026 | September 2023–2025 observations, mean |
| Mortgage financing | 93.4 | Oct 22 | Corresponding 2023–2025 weekly mean, inverted |
| Weather exposure | 108.1 | Oct 11–17 | Corresponding three-year station-first median |
| Matched review counts | 85.1 | Sep 13–Oct 26 | Sep 6–13 rate on the same 929 identities |
September existing-home turnover uses NAR’s original national release at 3.99 million seasonally adjusted annual sales, compared with the original September releases for 2023, 2024 and 2025. Their values are 3.96, 3.84 and 4.06 million. This keeps later revisions separate from the original-release comparison.[1][3][4]
The 2025 reference comes from NAR’s original release syndicated by GlobeNewswire. An annual sales rate describes the pace after seasonal adjustment, not the number of homes sold during one month.[5][1]
Mortgage financing uses the October 22 observation of 7.32%. Permits use the September observation of 1.400 million units at an annual rate. Mortgage observations are weekly, while permits are monthly; neither becomes an October weekly event because this report appears on Monday.[7][8]
Weather uses all ten approved stations and 70 distinct station-days for October 11–17, with three corresponding earlier-year weeks. The October 18–24 target contains only 50 of the required 70 station-days, so the accepted maximum-one-week lag applies. NOAA supplies the underlying daily maximum and minimum temperature records.[9]
The review panel retains the same 929 matched business identities. Its September 13–October 26 interval spans 43 days and shows 7,647 positive count changes and 1,303 downward changes, net 6,344. The comparison uses a seven-day-equivalent rate, not a reconstructed weekly path. The September 6–13 reference remains a single provisional interval, not an established seasonal norm. Reviews are not jobs or revenue.
The method retains the October 5 historical comparison break. Earlier published prints are not restated. No license-database counts, company totals, regional forecasts or local demand estimates are used in this edition. Search and review observations are attributed to the Echelon Reports Database, with source receipts retained privately.
Relevant next step
Decide which work deserves more attention
KKS website and advertising management can help connect service-specific offers, request paths and follow-up with the work an owner wants to win. Start with the repair or replacement category where the records show an actionable constraint, rather than a general promise of more traffic.
Read the previous Echelon Report, the report archive and the ERDI methodology.
Sources
- https://www.nar.realtor/newsroom/existing-home-sales-increased-1-5-in-september-according-to-nar-report
- https://www.globenewswire.com/news-release/2024/10/23/2967931/0/en/Existing-Home-Sales-Slid-1-0-in-September.html
- https://finance.yahoo.com/news/existing-home-sales-fell-2-140000394.html
- https://finance.yahoo.com/news/nar-existing-home-sales-report-140000251.html
- https://fred.stlouisfed.org/series/MORTGAGE30US
- https://fred.stlouisfed.org/series/PERMIT
- https://www.ncei.noaa.gov/products/land-based-station/global-historical-climatology-network-daily