
Editorial update: October 14, 2026. Original reporting dates are unchanged.
Week of October 5, 2026. Updated with a separate door-service search check and an owner action guide. The published six-component index remains unchanged.
Finding
Roofing contractors should not read a weak national average as a reason to cut marketing across the board. US search interest for “roof replacement” fell from the previous week but was 26.1% above the corresponding week last year. “Roof repair” showed the same split: down week to week, up 16.4% year over year. Those figures describe relative search interest, not a percentage increase in roofing jobs.
An owner needs to distinguish two problems: fewer suitable customers getting in touch and fewer estimates turning into profitable jobs. The first calls for checking local inquiries and the acquisition path; the second calls for reviewing estimates and margins. This edition puts the service-level readings beside a practical decision check before recommending more spending or a cut.
Echelon Reports examines market and competitor evidence for contractor owners. This weekly report provides national context; your service area, margins and available crews determine what to do with it.
Dated evidence table
The national average hides differences between services
Both roofing terms were above the corresponding week last year, while the other eight terms in the ten-term basket were below their year-earlier readings. A contractor with several services should therefore check the mix of work rather than treating the national basket as a single verdict on demand.
| Search term | Sept 27–Oct 3, 2026 | Previous week, Sept 20–26 | Corresponding week, Sept 28–Oct 4, 2025 | Change from corresponding 2025 week |
|---|---|---|---|---|
| Roof replacement | 58 | 66 | 46 | +26.1% |
| Roof repair | 64 | 82 | 55 | +16.4% |
| Window replacement | 45 | 53 | 46 | -2.2% |
| HVAC replacement | 31 | 38 | 32 | -3.1% |
| Bathroom remodel | 61 | 74 | 66 | -7.6% |
| AC repair | 34 | 49 | 37 | -8.1% |
| Foundation repair | 39 | 54 | 44 | -11.4% |
| Kitchen remodel | 64 | 71 | 76 | -15.8% |
| Furnace repair | 44 | 62 | 56 | -21.4% |
| Water heater replacement | 24 | 30 | 32 | -25.0% |
How to read this table: each term has its own 0–100 relative-interest scale. Compare a term with itself over time, not with another term. A roof-repair score of 64 does not mean more searches than a water-heater score of 24. All comparisons use the same October 5 retrieval for each term; incomplete October 4–5 readings are excluded. Source: Google Trends data retrieved through DataForSEO [1].
A separate door-service check: four terms, four different paths
The supplemental US web-search readings below cover four door terms outside the ten-term index. The retained window-replacement row above is still part of that original basket. Each row compares one term with itself; the scores do not rank door services against each other or establish demand in any town.
| Separate search term | Sept 27–Oct 3, 2026 | Sept 20–26, 2026 | Sept 28–Oct 4, 2025 | Change from prior week | Change from 2025 week |
|---|---|---|---|---|---|
| Door replacement | 40 | 42 | 38 | -4.8% | +5.3% |
| Entry door replacement | 23 | 21 | 53 | +9.5% | -56.6% |
| Storm door installation | 56 | 42 | 53 | +33.3% | +5.7% |
| Storm door replacement | 44 | 36 | 33 | +22.2% | +33.3% |
Storm door installation rose from 42 to 56 from the prior week; storm door replacement rose from 36 to 44. Entry door replacement rose from 21 to 23, yet was below its corresponding 2025 reading of 53. Broader door replacement slipped from 42 to 40 while remaining above its corresponding 2025 reading of 38. These are separately normalized relative-interest series, not counts of searches or jobs. The incomplete October 4–5 points were excluded. Source: the same DataForSEO [1] Trends endpoint; four paid task receipts and the retained window series were reviewed against the October 5 raw observations.
Analysis and counterargument
A softer week does not establish a weak roofing market
Roof-replacement interest moved from 66 to 58 in one week, a 12.1% decline. But the corresponding week last year scored 46. Roof repair moved from 82 to 64, a 22.0% decline, while the corresponding 2025 week scored 55. Both the weekly declines and annual increases are true.
The headline search component compares the basket with a preceding-year median spanning different seasons. A comparison with the corresponding autumn week answers a narrower question. The two comparisons can move in opposite directions, so the median alone is a poor basis for cutting a roofing budget.
For a roofer already receiving profitable local inquiries, this national basket is not a reason to cut working campaigns. Check repair and replacement separately before changing spend. A remodeler should test its own services instead of applying the roofing result to a different trade.
Weather, news or a brief burst of research could account for some of the national attention. A single week cannot establish a lasting trend, and these data do not measure opportunity in a particular territory. The recommendation is to test against local results, not to expect additional bookings or profit from the national reading alone.
More reviews do not settle the question
The same 929 business listings gained a net 2,958 reviews between September 13 and October 5. Their net daily rate was below the single earlier reference interval. Positive changes and downward corrections both affect that result, and customers can review work long after completion. Use competitors’ reviews to identify questions worth investigating, not as their sales ledger.
Owner decision
Choose the test that matches the problem
Use the last two complete weeks and the preceding two complete weeks as a short operating check. If you have comparable records from last year, add those too. Keep the service area, service categories and definitions unchanged. These are suggested review windows, not statistically validated thresholds.
| What your own records show | What to do first | How it could earn or protect money | What to measure |
|---|---|---|---|
| Qualified inquiries and profitable bookings are holding | Keep the working campaign stable. Check repair and replacement separately before moving budget. | Avoid cutting an acquisition source that is already producing profitable work. | Booked jobs, acquisition cost and expected job gross profit by service. |
| Qualified inquiries are down, but the share booking is steady | Check local visibility, missed calls and the service page customers reach. Fix a verified broken call path before buying more traffic. | Recover inquiries lost through a correctable access or visibility problem. | Qualified calls and forms, answered calls, estimates and subsequent bookings. |
| Estimates are steady or rising, but bookings are down | Review open estimates and follow up through your existing permitted contact process. Record price, financing, timing, scope and competitor objections separately. | Recover suitable work already in the sales pipeline rather than paying to replace every lost opportunity. | Estimates contacted, replies, bookings and margin after any concessions. |
| Bookings are rising, but margin or delivery is slipping | Check job costing, travel, callbacks and crew capacity before adding promotion. | Avoid purchasing more work that loses money or displaces better jobs. | Direct job costs, expected versus realized gross profit, backlog and callbacks. |
For a roofer: run a bounded repair-or-replacement check
Pick one service you actually want more of and one area you already serve. Confirm that you can deliver the work and that the relevant page, phone number and inquiry form work. Review existing local search and inquiry records before deciding which service to promote. The national figures do not choose a town or a keyword bid for you.
Keep the existing offer and spending stable during a two-week diagnostic, unless you find a clear defect. If you then test a page or campaign change, set the budget ceiling and review date before starting, change one major element, and label the result as a test rather than proof of causation. Record the source, requested service, estimate, booking and expected gross profit for each qualified inquiry.
Decision rule: continue only when the resulting jobs meet your margin requirement and you have capacity. Revise or stop if acquisition and test costs consume the expected job gross profit, inquiries fall outside your service area, or the work crowds out more profitable bookings. Allow estimates enough time to close; two weeks without a booking is not conclusive for a long sales cycle.
For a door installer: check the service before the budget
For a door installer, split entry-door and storm-door inquiries in the worksheet below. Check the service you can actually deliver, the estimates it produces and gross profit after acquisition costs before shifting a campaign. A national rise for a storm-door term does not tell you whether your local market has more jobs. If suitable local inquiries and profitable bookings hold, keep the working acquisition path; if estimates fail to close, investigate conversion before buying more traffic.
A worksheet you can use at the next meeting
| Record for each service | Your figure | What it tells you |
|---|---|---|
| Qualified inquiries: customers seeking work you serve in your territory | Fill from call and form records | Whether the flow of suitable opportunities changed. |
| Estimates issued and jobs booked | Fill from your estimating or CRM records | Where opportunities are dropping out. Track the same inquiry group through its sales cycle. |
| Booking rate | Booked jobs divided by qualified inquiries in that group | Whether acquisition or conversion needs attention. Leave undefined if there were no inquiries. |
| Expected job gross profit | Expected job revenue less estimated direct job costs | Whether booked work is worth acquiring. Reconcile with actual costs after completion. |
| Acquisition and test cost | Advertising plus incremental test costs | What you spent to obtain the work. |
| Expected gross profit after acquisition | Expected job gross profit less acquisition and test cost | A contribution check, not net profit. Overhead, collection risk and other costs still matter. |
Do not assign hypothetical revenue to the national search scores. Use your own tickets, direct costs and accepted work.
Next observation
At your next review, ask whether the local evidence confirmed or contradicted the national signal. A roofer whose profitable inquiries remain healthy has no evidence here for an across-the-board cut. A roofer whose inquiries are falling should investigate the local cause even though national roofing interest was above last year.
Echelon’s next observation should test whether the service-level split persists in another complete week. A sustained pattern would justify deeper local research; a reversal would weaken the case. This report does not yet establish that persistence.
Scope method source notes
The complete index: 90.1, provisional
The Echelon Residential Demand Index (ERDI) combines six context measures with equal weights. The October 5 reading remains 90.1. Each component’s 100 means equality with its own reference, not a shared seasonal norm. The index is not a prediction of jobs or revenue. This version starts a new comparison series; do not calculate a change from older published index values.
| Component | Index | Observation | Reference and practical limit |
|---|---|---|---|
| Search interest | 74.6 | Sept 27–Oct 3 | Ten-term mean against its preceding 52-week median. Different from the service-level annual comparisons above. |
| Existing-home turnover | 100.3 | August 2026 | NAR’s 3.98 million seasonally adjusted annual rate against the mean of three previous original August releases. Annualized pace, not actual monthly jobs. |
| New-housing permits | 94.9 | August 2026 | 1.403 million annualized housing units against three prior August observations. New housing, not renovation permits. |
| Mortgage financing | 91.3 | Week ending Oct 1 | 7.28% mortgage average against a 6.65% three-year reference, with the ratio inverted. Not a contractor financing offer. |
| Weather exposure | 102.1 | Sept 20–26 | Ten stations, all 70 station-days, against a three-year nearest-week reference. One week of permitted reporting lag; not local service demand. |
| Matched review counts | 77.5 | Sept 13–Oct 5 | Same 929 listings; actual 22-day net rate against one earlier seven-day interval. Provisional, not a count of jobs. |
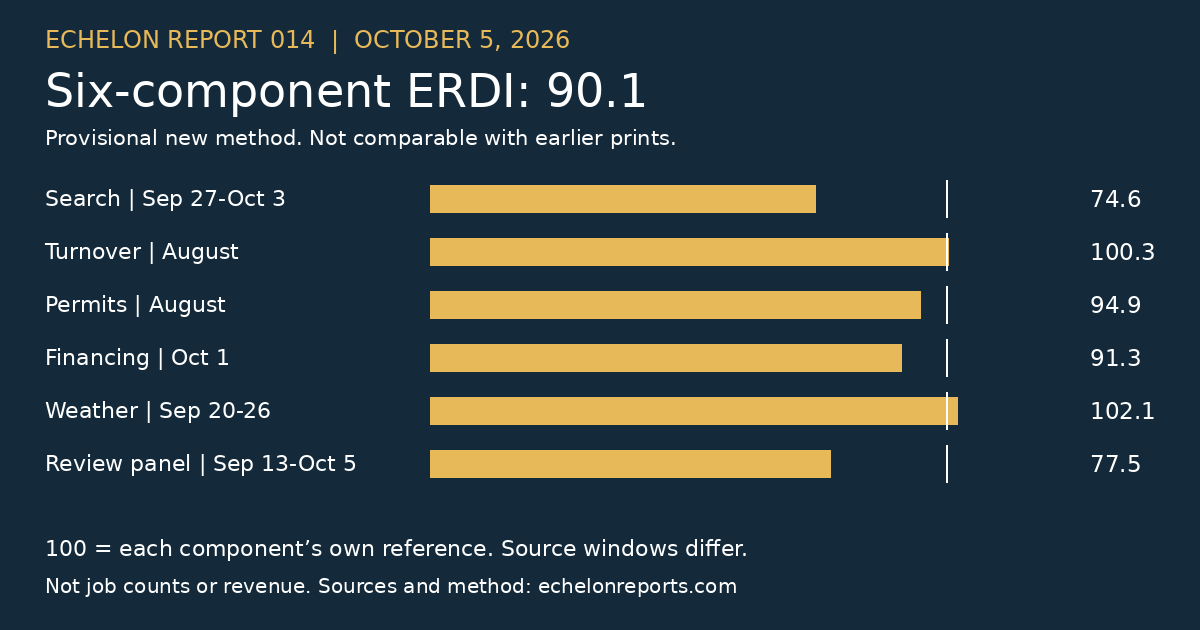
The review panel’s net 2,958 combines positive changes totaling 3,986 and negative changes totaling 1,028. Its seven-day-equivalent rate is 1.013 per listing, compared with 1.307 in September 6–13. The interval average does not reconstruct missing weekly observations. The cohort is not presented as a representative census of US contractors.
Source observations were retained October 4 for permits and mortgage rates, and October 5 for search and weather. Review observations are dated September 6, September 13 and October 5. NAR turnover uses original-release figures, kept separate from later-revised histories. All arithmetic uses unrounded inputs before display rounding.
Sources: NAR’s August 2026 release [2], original August releases for 2023 [3], 2024 [4] and 2025 [5]; Census/HUD permits via FRED [6]; Freddie Mac mortgage rates via FRED [7]; NOAA station observations [8]. Echelon’s retained listing observations support the review calculation.
The methodology [9] explains method erdi-six-interval-v1-20261005. The report archive [10] preserves earlier editions, including the previous housing report [11]. The supplemental door terms inform only the service discussion; none enters the frozen six-component reading.