
Editorial update: October 14, 2026. Original reporting dates are unchanged.
The archived index was computed August 30 and this article was published August 31, before its assigned September 5 week-ending label. That label identifies the reporting slot, not a completed observation period. The comparisons below retain the original index values and source windows rather than implying that information from the rest of that week was already available.
The Echelon Residential Demand Index (ERDI) combines financing, housing turnover, permits, search demand, weather and Echelon’s contractor review panel to read US residential trades conditions. In this archived method, 100 is the seasonal reference for each component. The composite is a directional measure, not a job count.
1. The print
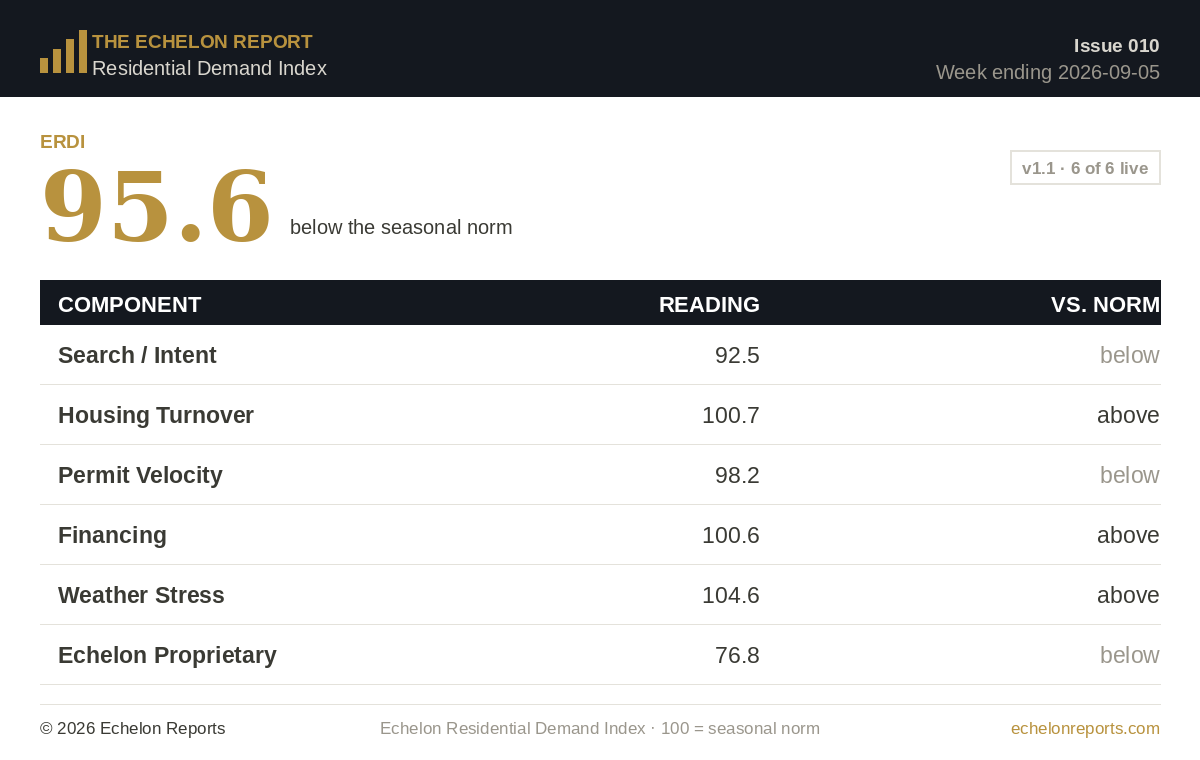
Under the historical September 5, 2026 label, the archived ERDI printed 95.6, down 3.3 points from the preceding 98.9 reading. The value is the frozen print from this historical method, not a recalculation using the comparison rules adopted later.
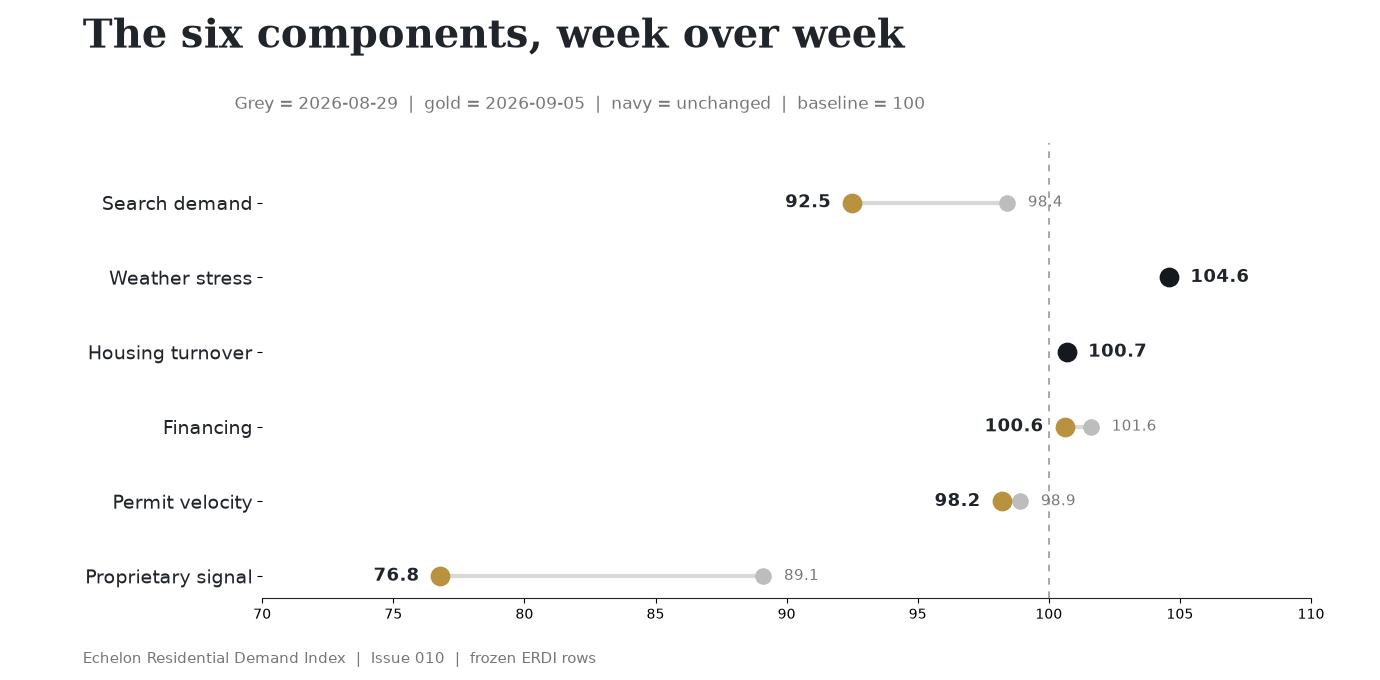
Two components accounted for most of the 3.3-point decline, but they measure different parts of the market. The contractor-panel signal fell 12.3 points from 89.1 to 76.8, subtracting 2.05 composite points; search demand fell 5.9 points from 98.4 to 92.5 and subtracted another 0.98. Their combined 3.03-point contribution explains why the weekly composite weakened despite three components remaining above their seasonal references.
The five market-facing components averaged 99.3, down from 100.8 in the preceding print, although three of the six total components still stood above 100. That below-reference average describes the group rather than every individual measure: financing, weather and turnover remained above their own seasonal references. The distinction prevents a group mean from becoming an unsupported claim that conditions weakened uniformly.
This decline was no longer confined to the contractor panel. Search fell for a second print, and the average of the five market-facing measures crossed below its seasonal reference. That combination provides more evidence of softness than the earlier panel shock alone, but it does not establish a lasting contraction. Three of the six components remained above 100, leaving a divided picture rather than a market-wide fall.
2. The components
| Component | This week | Last week | What moved |
|---|---|---|---|
| Search demand | 92.5 | 98.4 | The ten-keyword basket fell 5.9 points. DataForSEO supplies the Google Trends series used in the basket.[5] |
| Housing turnover | 100.7 | 100.7 | Existing-home sales held at a 4.06 million annual rate against a 4.03 million three-year same-month average.[3] |
| Permit velocity | 98.2 | 98.9 | July permits measured 1.433 million against a 1.459 million three-year same-month average.[4] |
| Financing | 100.6 | 101.6 | The 30-year mortgage rate averaged 6.66 percent against a 6.70 percent three-year same-week average.[2] |
| Weather stress | 104.6 | 104.6 | The ten-market thermal-stress basket held above its same-week seasonal norm. The series uses NOAA daily station observations.[6] |
| Echelon proprietary | 76.8 | 89.1 | The panel recorded 1,184 net new reviews across 937 comparable members, or 1.26 per member. |
Numbers of record
The four frozen prints were 99.9, 95.2, 98.9 and 95.6, with the current reading 3.3 points lower than the preceding one. That alternating sequence matters because the latest decline followed a rebound rather than a steady fall over all four observations. Preserving the original values also avoids treating a later change in source comparison rules as if it had been available when this historical issue was written.
Three components remained above 100 and three fell below: search stood at 92.5, turnover at 100.7, permits at 98.2, financing at 100.6, weather stress at 104.6 and the panel at 76.8. The index averages these distinct readings, so the sharp panel weakness can pull the headline down without showing that all residential trades conditions declined together. The split also identifies where a later recovery would need to appear if the softness was temporary.
3. Findings from the Echelon database
The panel weakness has lasted beyond one observation
The contractor-panel component fell to 56.6 three prints earlier, recovered to 89.1 and then slipped to 76.8. The current observation covered 937 comparable members, which added 1,184 net new reviews, or 1.26 each. This was the third consecutive print below the panel’s seasonal reference. The partial recovery after the first sharp fall has therefore not yet become a sustained return to baseline.
Market-facing conditions weakened for a second week
The five measures outside the contractor panel averaged 102.9 three prints earlier, 100.8 in the preceding print and 99.3 now. Their 3.6-point decline across two observations was driven substantially by search, which moved from 113.7 to 98.4 to 92.5. Unlike a single review-panel shock, the decline in the market-facing average places a second source of weakness in the recent sequence, although the component mix still prevents a uniform-demand conclusion.
The ten-term search basket did not move uniformly against its prior four-week average. Foundation repair rose 8.0 points and HVAC replacement rose 0.8, while roof replacement was 19.5 points below its recent average, AC repair 9.0 below, roof repair 7.8 below and bathroom remodeling 4.2 below. More terms weakened than strengthened, but the two gains caution against reading the overall search decline as a fall in every service category.
Search softened across several services, with foundation repair an exception and HVAC replacement slightly above its recent average. That combination does not fit either a uniform collapse or a clean rotation in which losses in one category are neatly offset by gains elsewhere. It suggests a weaker broad basket whose exceptions should be examined by service rather than erased by the composite score.
The headline decline is concentrated, but not isolated
The contractor panel accounted for 62.1 percent of the composite decline, with search contributing another 29.7 percent. Financing and permits together subtracted 0.29 point, while turnover and weather did not move in this comparison.
The two largest drags measure different stages of activity. Search tracks relative homeowner attention across ten service categories, while the contractor panel tracks net new reviews among comparable businesses. Both moved down in this observation, which is a reason to watch the next readings closely. Their simultaneous declines cannot establish that the same customers or jobs underlie both measures, nor can review counts alone show a revenue decline.
4. The strongest alternative explanation
There is another interpretation of the late-summer reading. Cooling demand can ease as temperatures moderate, Google Trends can recalculate normalized values within its query window, and reviews do not arrive on a fixed schedule after work is completed. The weather component held at 104.6, which also cuts against a claim that every operating condition weakened. A repeated decline across the market-facing measures would do more to distinguish a persistent slowdown from these timing effects.
A further decline in the market-facing average while search and the panel remained below 100 would give the contraction interpretation another observation in its favor. If search returned toward 100 and review additions approached their baseline instead, the recent movement would fit better with timing and seasonal normalization. The two paths have different implications, but this archived print cannot tell us which would follow.
5. What operators should watch
Search breadth
The next search reading can show whether softness remains concentrated in cooling, roofing and remodeling or extends into water heating, foundation repair and other replacement categories. A second broadly weak basket would carry more weight than another mixed observation because it would reduce the possibility that the decline came primarily from a change in service mix. The current national terms still require comparison with local inquiries before an operator changes service spending.
Review velocity
The panel needs another observation beyond its partial rebound from the earlier 56.6 reading. A return toward the prior review-rate baseline would weaken the slowdown interpretation, whereas another print near 1.26 reviews per member or lower would point to a slower late-summer panel pace. Neither path should be described as confirmed until the next comparable-member review count is available, and neither alone measures booked revenue.
Permits and financing
Financing remained just above its seasonal reference, whereas permits stayed below it. Better borrowing conditions had not yet appeared as an above-baseline permit reading in the data available for this issue. Because permits arrive on a monthly schedule, the next release would test that gap with a different observation window rather than immediately confirming or overturning the weekly search and review signals.
The bottom line
The contractor panel produced the largest part of the fall, but search also declined for a second print and the five market-facing measures averaged 99.3. Those movements give the 95.6 reading more support than a panel-only drop would have. Three components still remained above their seasonal references, however, so the evidence points to an uneven board whose weaker side needs confirmation in another observation.
Methodology and limitations
ERDI is an equal-weighted composite of six components. Each component is indexed to 100 using a baseline suited to the source series.
- Financing uses the current 30-year mortgage rate against the average for the same calendar week in the prior three years. Lower rates score higher.
- Housing turnover and permit velocity use the latest monthly level against the same-month average for the prior three years.
- Search demand uses the latest complete weekly value from a ten-keyword residential-trades basket against its trailing 52-week median.
- Weather stress uses the latest complete week from ten US weather stations against the same-week median from prior years.
- The proprietary signal uses weekly net review growth across a fixed contractor panel against the panel’s prior weekly median.
Monthly series follow their source publication schedules rather than the report’s weekly cutoff, so the figures in one issue can describe different observation windows. Google Trends values are normalized within the selected query window and can change when its history is recalculated. Echelon therefore preserves the first computed weekly index as its number of record; that freeze keeps the historical comparison intact without claiming that every underlying input was newly observed on the report date.
The proprietary panel measures review activity, not booked revenue. Review additions can reflect completed-job volume, review collection practices, platform timing, review removals, or a combination of those factors.
Echelon’s database snapshot contains 2,279,910 license or credential records across 20 state systems, including 1,217,720 records classified as active. These are source-native license or credential units, not unique companies or workers. Louisiana, Mississippi, North Carolina, Nevada, Oklahoma, Rhode Island, and Washington have current collection or comparability limits, so this issue makes no claim about week-over-week national license movement.
This issue uses archived source pulls and contractor-panel snapshots frozen on August 30, 2026. ERDI is a directional demand indicator, not a revenue forecast. Market-level and company-level decision support remains part of Echelon’s paid intelligence work. This is not accounting, legal, or investment advice.
Sources
[1] https://echelonreports.com/echelon-report-009-index-rebounds-to-98-9-market-board-softens
[2] https://fred.stlouisfed.org/series/MORTGAGE30US
[3] https://fred.stlouisfed.org/series/EXHOSLUSM495S
[4] https://fred.stlouisfed.org/series/PERMIT
[5] https://docs.dataforseo.com/v3/keywords_data-google-trends-explore-live/
[6] https://www.ncei.noaa.gov/products/land-based-station/global-historical-climatology-network-daily
Put the signal to work in your market
The public report tracks the national board. Echelon’s paid intelligence resolves the market, licenses, competitors, ownership, and commercial decision behind it.