
Editorial update: October 14, 2026. Original reporting dates are unchanged.
The archived index was computed September 6 and this article was published September 7, before its assigned September 12 week-ending label. That label identifies the reporting slot, not a completed observation period. The comparisons below retain the original index values and source windows rather than implying that information from the rest of that week was already available.
The Echelon Residential Demand Index (ERDI) combines six measures of US residential trades conditions: financing, housing turnover, permits, search demand, weather and Echelon’s contractor review panel. In this archived series, 100 represents each component’s seasonal reference. The index is a composite of those measures, not a count of jobs.
1. The print
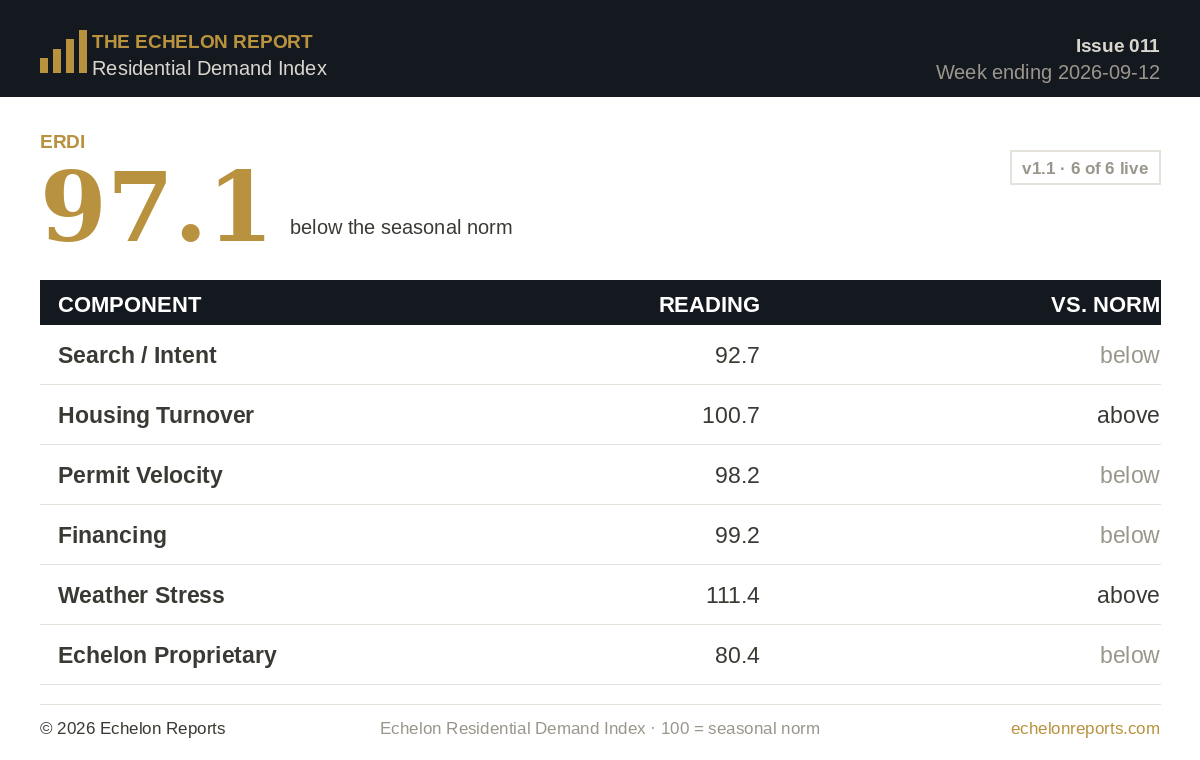
Under the historical September 12, 2026 label, the archived ERDI printed 97.1, up 1.5 points from the preceding 95.6 reading. That change belongs to the historical six-component series and should not be recalculated under the method adopted in later editions.
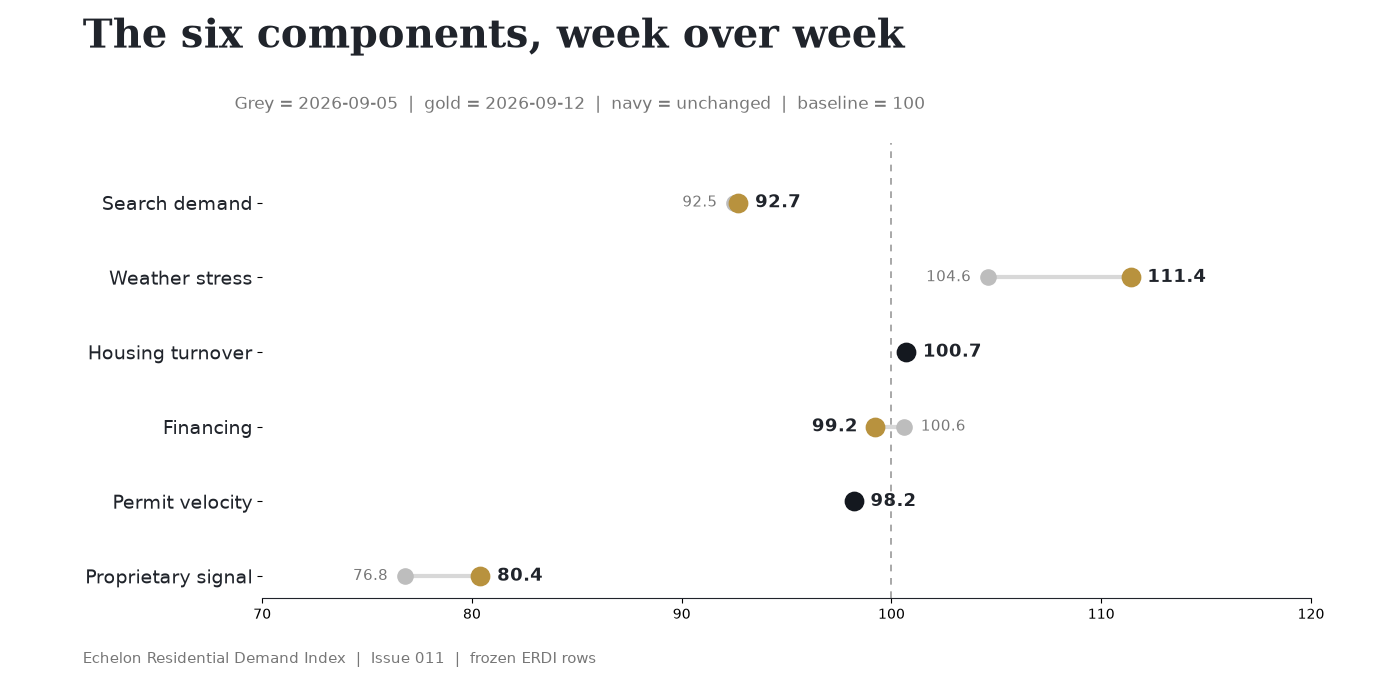
The 1.5-point rebound came primarily from two measures rather than a general improvement. Weather stress rose 6.8 points to 111.4 and added 1.13 points to the composite; the contractor-panel signal rose 3.6 points to 80.4 and added another 0.60. Together, those contributions exceeded the headline gain at 1.73 points because financing weakened enough to subtract 0.23 point. This comparison describes the sources of the weekly movement, not the number of households requesting work.
The five measures outside the contractor panel averaged 100.4 against 99.3 in the preceding observation, although the number of all six components above their baselines declined from three to two. Weather’s relatively large increase lifted the average while financing crossed below 100. The average measures the combined level; the above-baseline count measures how widely that strength is distributed, so their opposing movements are consistent.
Weather supplied most of the improvement as the headline approached its comparison baseline, while search barely changed and financing slipped below 100. The contractor panel also improved without reaching its own baseline for a fourth consecutive observation. These differing movements support a weather-led rebound in the indicators, rather than a conclusion that customer interest strengthened consistently across services or that contractors completed more work nationwide.
2. The components
| Component | This week | Last week | What moved |
|---|---|---|---|
| Search demand | 92.7 | 92.5 | The ten-keyword basket rose 0.2 point. DataForSEO supplies the Google Trends series used in the basket.[5] |
| Housing turnover | 100.7 | 100.7 | Existing-home sales held at a 4.06 million annual rate against a 4.03 million three-year same-month average.[3] |
| Permit velocity | 98.2 | 98.2 | July permits held at 1.433 million against a 1.459 million three-year same-month average.[4] |
| Financing | 99.2 | 100.6 | The 30-year mortgage rate averaged 6.71 percent against a 6.66 percent three-year same-week average.[2] |
| Weather stress | 111.4 | 104.6 | The ten-market thermal-stress basket moved farther above its same-week seasonal norm. The series uses NOAA daily station observations.[6] |
| Echelon proprietary | 80.4 | 76.8 | The panel recorded 1,226 net new reviews across 938 comparable members, or 1.31 per member. |
Numbers of record
The latest archived print of 97.1 followed a 95.6 reading, within a four-print sequence of 95.2, 98.9, 95.6 and 97.1. The series moved up, down and up again rather than improving continuously, which makes a single week’s gain a weak basis for declaring a new trend. These figures are the frozen values reported by the historical six-component method, not a backcast using subsequent source windows or comparison rules.
Only two of the six components exceeded their seasonal references, leaving four below 100: search was 92.7, housing turnover 100.7, permits 98.2, financing 99.2, weather stress 111.4 and the contractor panel 80.4. Weather was sufficiently far above reference to offset some of the softness elsewhere when the components were averaged. The distribution therefore matters as much as the composite value to anyone trying to assess how widespread the weekly change was.
3. Findings from the Echelon database
The rebound came from weather and the panel, not search
The panel improved, but stayed weak for a fourth print
Across four observations, the contractor-panel component recorded 56.6, 89.1, 76.8 and 80.4, remaining below its comparison baseline despite two intervening increases. In the latest observation, 938 comparable members gained 1,226 net reviews, equivalent to 1.31 per member against a 1.63 weekly baseline. The improvement from the preceding rate of 1.26 is real within the comparison, but does not establish a sustained recovery or explain whether work volume, collection practices or posting schedules caused the earlier weakness.
The market-facing average recovered while breadth narrowed
4. An alternative interpretation
Weather-related repair pressure can change before monthly housing releases describe a corresponding shift, which leaves open an early-recovery interpretation of this observation. The improving contractor panel provides another indicator to examine, but search remained weak and reviews stayed below baseline. The interpretation therefore depends on subsequent observations showing a broader improvement, rather than on treating a weather-driven increase as confirmation of completed work.
A later observation could help distinguish a broader recovery from a temporary weather pulse. If search rises and the panel approaches 100 while the market-facing average holds above reference, more independent measures would support the recovery interpretation. If weather cools while search and reviews remain weak, this observation would look more like an isolated source of service urgency. Neither outcome had occurred in the frozen September print, so this is a test for subsequent data rather than a forecast.
5. What operators should watch
Search breadth
The service terms moved in different directions against their prior four-week averages. HVAC replacement rose 7.5 points, foundation repair 5.2 and AC repair 1.2, while roof replacement was the weakest term at 16.2 points below its average. Window replacement trailed by 5.8 points and kitchen remodeling by 3.8. The variation matters to an operator because a mixed national search basket cannot stand in for the local demand for any one service.
An improvement extending across replacement, repair and remodeling categories would carry more weight than another mixed basket because it would show breadth beyond the few services gaining attention in this observation.
Review velocity
Panel reviews increased from 1.26 to 1.31 per comparable member, still short of the 1.63 weekly baseline. Another increase would move the rate closer to that benchmark, but one additional step would not settle whether completed work or review-collection timing caused the earlier decline. If the rate held flat or moved lower, the four-print run of below-reference panel readings would remain unresolved.
Financing and permits
Financing crossed below its seasonal reference as the mortgage rate reached 6.71 percent, while permits stood at 98.2 on a July data vintage. These measures put the weekly search, weather and review readings in a wider housing context, but their observation schedules differ. A rate change or an older monthly permit value therefore cannot quickly resolve whether the latest weather-led movement represents a lasting rise in service demand.
The bottom line
The ERDI rose from 95.6 to 97.1, chiefly on weather and panel reviews. Search barely changed, so the higher index should not be read as a broad rise in customer interest. Operators should compare the national pattern with inquiries in their own services and markets.
Methodology and limitations
ERDI is an equal-weighted composite of six components. Each component is indexed to 100 using a baseline suited to the source series.
- Financing uses the current 30-year mortgage rate against the average for the same calendar week in the prior three years. Lower rates score higher.
- Housing turnover and permit velocity use the latest monthly level against the same-month average for the prior three years.
- Search demand uses the latest complete weekly value from a ten-keyword residential-trades basket against its trailing 52-week median.
- Weather stress uses the latest complete week from ten US weather stations against the same-week median from prior years.
- The proprietary signal uses weekly net review growth across a fixed contractor panel against the panel’s prior weekly median.
Monthly housing inputs change when their agencies release observations, whereas searches, weather and panel reviews follow separate collection windows. A weekly composite can therefore combine unchanged monthly values with newer observations from the other sources. Google Trends also normalizes results within its selected query window and can recalculate earlier values; Echelon preserves the first computed weekly index so that later revisions do not silently rewrite this historical comparison.
The proprietary panel measures review activity, not booked revenue. Review additions can reflect completed-job volume, review collection practices, platform timing, review removals, or a combination of those factors.
Echelon’s September 7 database snapshot contains 2,270,216 license or credential records across 20 state systems, with 1,201,419 classified as active. These records count source-native credentials, not unique businesses or workers. Current movement endpoints were unsafe in California, Florida, Oklahoma and Wisconsin; Nevada collection failed, while Louisiana, Mississippi, North Carolina and Rhode Island were degraded. This issue does not report week-over-week national license movement.
This issue relies on source pulls and contractor-panel snapshots frozen on September 6, 2026. Its ERDI is a directional indicator rather than a forecast of revenue; Echelon offers market-level and company-level decision support as paid intelligence work. The report does not provide accounting, legal or investment advice.
Sources
[1] https://echelonreports.com/echelon-report-010-index-falls-to-95-6-as-search-and-review-velocity-weaken | Echelon Report 010
[2] https://fred.stlouisfed.org/series/MORTGAGE30US | 30-Year Fixed Rate Mortgage Average in the United States
[3] https://fred.stlouisfed.org/series/EXHOSLUSM495S | Existing Home Sales
[4] https://fred.stlouisfed.org/series/PERMIT | New Privately-Owned Housing Units Authorized by Building Permits
[5] https://docs.dataforseo.com/v3/keywords_data-google-trends-explore-live | DataForSEO Google Trends API
[6] https://www.ncei.noaa.gov/products/land-based-station/global-historical-climatology-network-daily | NOAA Global Historical Climatology Network Daily
Put the signal to work in your market
The public report tracks the national board. Echelon’s paid intelligence resolves the market, licenses, competitors, ownership, and commercial decision behind it.