
Editorial update: October 14, 2026. Original reporting dates are unchanged.
The archived index was computed August 16 and this article was published August 17, before its assigned August 22 week-ending label. That label identifies the reporting slot, not a completed observation period. The comparisons below retain the original index values and source windows rather than implying that information from the rest of that week was already available.
THE ECHELON REPORT · ISSUE 008 · MONDAY, AUGUST 17, 2026
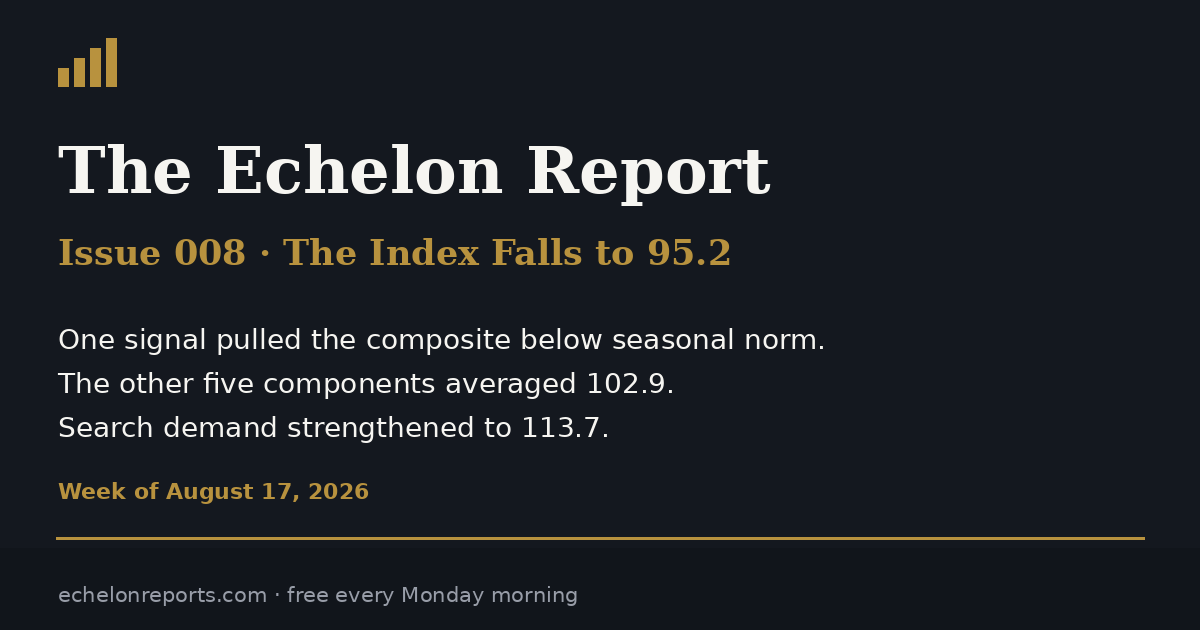
The Index Falls to 95.2 on a Review-Velocity Shock
The Echelon Residential Demand Index (ERDI) combines national financing, housing turnover, permits, consumer searches and weather measures with review activity from a contractor panel. Each component is normalized against its own comparison baseline before entering the equally weighted composite. The resulting index describes the balance of these indicators, while the underlying records retain their different populations and observation periods.
Issue 007 was not published, but its frozen 99.9 index print remained in the historical series and supplies the previous-week comparison for this issue. The last published report was Issue 006 at 105.1. Those comparisons cover different intervals: the weekly change is measured against 99.9, while the change since the last published report is measured against 105.1.
1 · The Print
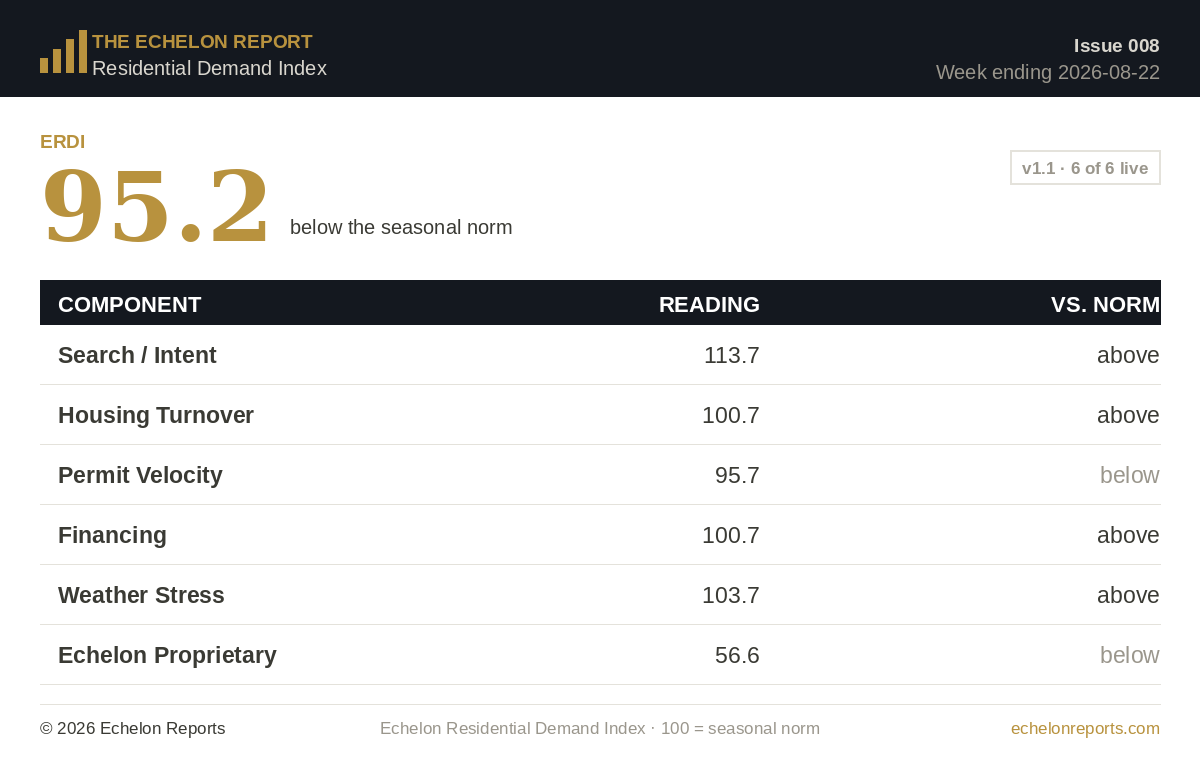
Under the historical August 22, 2026 label, the ERDI printed 95.2, down 4.7 points from the previous week’s unpublished 99.9 reading and 9.9 points from the last published 105.1 reading. The comparison with 99.9 follows the frozen weekly series even though Issue 007 itself was not published; comparing only published issues would describe a different interval.
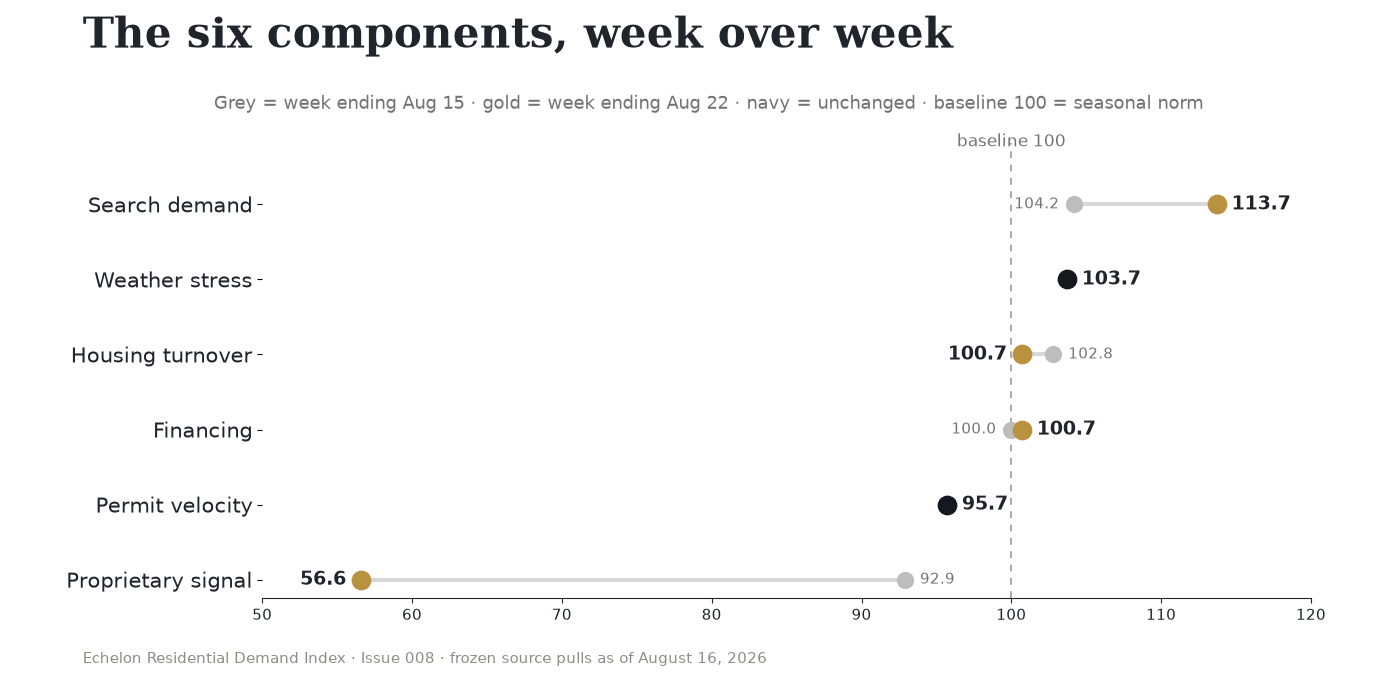
The contractor-panel signal fell 36.3 points from 92.9 to 56.6, subtracting 6.1 points from the equal-weighted composite. Over the same interval, the other five measures added 1.4 composite points and their average rose from 101.3 to 102.9. Those opposing movements produced a net 4.7-point decline, which should not be mistaken for evidence that all six measures weakened together.
The contractor-panel decline pushed the composite below 100 despite stronger search and financing readings and four components remaining above their individual baselines. This concentration matters when interpreting the 95.2 headline: the principal change was in recorded review activity, rather than a consistent deterioration across all six sources. The next comparable panel observation would help establish whether that break persisted.
2 · The Components
| Component | This week | Last week | What moved |
|---|---|---|---|
| Search demand | 113.7 | 104.2 | Search interest rose 9.5 points. Water-heater replacement, HVAC replacement, and furnace repair led the move. DataForSEO supplies the Google Trends series used in the basket.[5] |
| Housing turnover | 100.7 | 102.8 | July existing-home sales ran at a 4.06 million annual rate against a 4.03 million three-year same-month average.[3] |
| Permit velocity | 95.7 | 95.7 | June permits remained at 1.374 million against a 1.435 million three-year same-month norm. This is the only market-facing component below baseline.[4] |
| Financing | 100.7 | 100.0 | The 30-year mortgage rate averaged 6.67 percent against a 6.72 percent three-year same-week average.[2] |
| Weather stress | 103.7 | 103.7 | The ten-market thermal-stress basket remained above its same-week seasonal norm. The weather series uses NOAA daily station observations.[6] |
| Echelon proprietary | 56.6 | 92.9 | Review velocity fell to 0.97 net new reviews per comparable panel member, against a 1.71 weekly median baseline. |
Numbers of Record
The ERDI printed 95.2 for the week ending August 22, 2026, compared with the frozen prior-week value of 99.9. The last published print, for the week ending August 8, was 105.1. Because the intermediate index observation was retained even though its issue was not published, the weekly comparison and the comparison with the last published report span different periods.[1]
Four components exceeded their reference of 100: search demand was 113.7, housing turnover 100.7, financing 100.7 and weather stress 103.7. Permit velocity stood below its reference at 95.7, alongside the much weaker contractor-panel reading of 56.6. This distribution distinguishes a concentrated panel decline from weakness across every component.
3 · The Read
The panel decline outweighed the other components
The five market-facing components averaged 102.9 against 101.3 in the preceding observation, although their individual movements differed. Search increased from 104.2 to 113.7 and financing from 100.0 to 100.7, while housing turnover declined from 102.8 to 100.7; weather and permits were unchanged. Their combined improvement was insufficient to offset the contractor panel’s 36.3-point decline in a composite that assigns equal weight to each component.
Search increased, with differences across service categories
Search demand rose from 104.2 to 113.7 in the latest complete week, led by the service terms in the list below. The basket rose even though roof replacement fell against its own prior four-week average. A contractor should compare the relevant service rather than assume that every search term moved with the overall basket.
- water heater replacement: 90 on the 0-to-100 Trends scale, 38.5 points above its prior four-week average;
- HVAC replacement: 79, up 25.5 points;
- furnace repair: 89, up 16.2 points;
- foundation repair: 52, up 10.0 points;
- roof repair: 80, up 6.0 points.
Roof replacement fell to 62, or 9.8 points below its prior four-week average, while several mechanical repair and replacement terms rose. The list shows why the aggregate search score of 113.7 cannot describe every service equally.
Review velocity needs confirmation
The proprietary panel contained 965 contractors; this comparison covered 936 members. Net review velocity fell from 1.63 to 0.97 new reviews per member, a 40.6 percent weekly decline. The resulting 56.6 component reading compares the current rate with the panel’s 1.71 median weekly baseline. The comparable-member count matters because the index uses a rate across the comparison set rather than a national count of completed jobs.
The panel’s 40.6 percent decline concerns net review additions per comparable member, not a corresponding percentage decline in contractor revenue. A review can follow completed work after a delay, and collection practices or platform removals can also affect the recorded total. Establishing the business explanation requires records that connect inquiries, completed jobs and review requests, rather than assuming that national search interest and panel reviews describe the same customers.
Another panel reading would help test the break against elevated search. If review velocity stays near 1.0 while search stays above 110, the difference could reflect when searches, completed work and reviews appear in their respective sources. The figures alone cannot show failed conversions.
4 · What to Watch
The next comparison should examine whether the contractor-panel decline persists alongside elevated search interest, using consistent member selection and the actual dates of both observations. The July permit release provides a separate check on housing activity, but its monthly reporting window cannot establish why review additions changed within one week.
1. Does review velocity rebound?
A move back toward the panel’s 1.71 weekly baseline would lift an equal-weighted composite substantially even if the other five components did not improve further. A second weak reading, by contrast, would turn a one-week warning into a pattern that needs closer investigation. The distinction depends on another actual observation, since the current review count cannot explain its own cause.
2. Does search hold above 110?
Search demand rose from 104.2 to 113.7, but the individual terms were uneven, with water heaters, HVAC replacement and furnace repair contributing to the stronger mix. Another observation above 110 would offer more support for sustained relative search interest despite slower panel reviews. Even then, searches would measure attention rather than the number of customers who booked a job.
3. What will the July permit release show?
Permit velocity remained at 95.7 on June data, making it the only market-facing component below its seasonal reference in this issue. The next July release would provide a later view of residential activity, although monthly permits cannot settle the meaning of a single weekly review-panel change. The apparent gap between improving financing and below-reference permits therefore remained open in this frozen print.
The Bottom Line
The ERDI fell to 95.2 despite an improvement in the five market-facing measures taken together. That divergence makes the contractor-panel break the main issue to investigate, rather than a reason to describe every source as weak. A later return in review velocity would change the panel interpretation without rewriting the archived values for this week.
ECHELON REPORTS · THE DEAL LEDGER
The demand index tracks the aggregate picture. The Deal Ledger follows individual licensing and ownership records for firms moving within subscriber markets.
The Deal Ledger monitors licensing and ownership records for early acquisition, succession, qualifier, and operating-company signals. Each subscriber edition is limited to the markets and targets in the client’s mandate.
Methodology and Limitations
ERDI is an equal-weighted composite of six components. Each component is indexed to 100 using a baseline suited to the source series.
- Financing uses the current 30-year mortgage rate against the average for the same calendar week in the prior three years. Lower rates score higher.
- Housing turnover and permit velocity use the latest monthly level against the same-month average for the prior three years.
- Search demand uses the latest complete weekly value from a ten-keyword residential-trades basket against its trailing 52-week median.
- Weather stress uses the latest complete week from ten US weather stations against the same-week median from prior years.
- The proprietary signal uses weekly net review growth across a fixed contractor panel against the panel’s prior weekly median.
The housing series follow their agencies’ publication schedules, so an index assigned an August reporting label can still contain June permit data. Search observations have a different constraint: Google Trends normalizes values within the selected query window and can revise earlier observations when that window changes. Echelon preserves the first computed index as the archived print, separating subsequent source revisions from what this historical issue originally reported.
This issue uses Echelon’s archived source pulls and contractor-panel snapshots frozen on August 16, 2026. ERDI is a directional demand indicator, not a revenue forecast. Echelon Reports publishes public-records and market intelligence. This is not accounting, legal, or investment advice.
Sources
- Echelon Report 006: The Index Exhales to 105.1
- FRED: 30-Year Fixed Rate Mortgage Average
- FRED: Existing Home Sales
- FRED: New Privately-Owned Housing Units Authorized
- DataForSEO: Google Trends API Overview
- NOAA NCEI: Global Historical Climatology Network Daily
MIKE WARNER | ECHELON REPORTS
mike@echelonreports.com | linkedin.com/in/jmichaelwarner | x.com/_Mike_Warner