
Edition: October 19, 2026. U.S. search observations: October 11–17. Source dates differ across the six components.
Finding
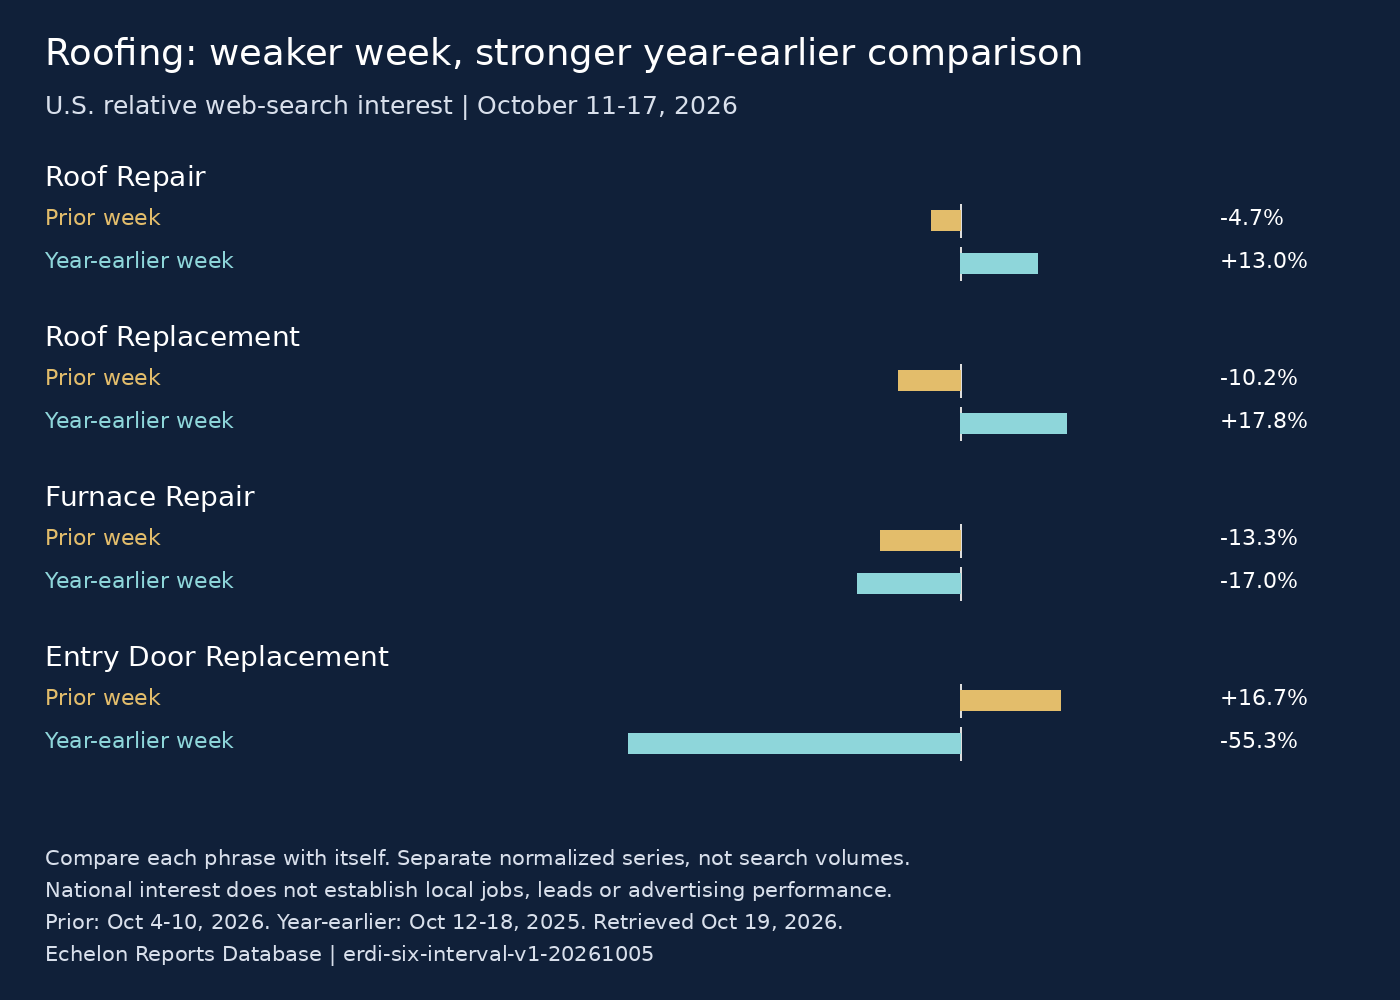
Nine of the ten core service phrases lost national search interest from the preceding week. Roofing still looks different from much of that basket: roof-replacement interest fell 10.2% for the week but stood 17.8% above the corresponding week last year. Roof-repair interest fell 4.7% while remaining 13.0% above its year-earlier reading. These are Echelon Reports Database observations of relative search interest, not counts of local customers.
For a roofing owner, the practical decision is to review repair and replacement inquiries separately before cutting a productive campaign or offering a blanket discount. A weaker week can coexist with a stronger year-earlier comparison. Neither comparison tells you whether your own estimates are becoming profitable jobs.
What changed since the last measurement
Last week’s edition focused on a recent furnace-repair pickup. This week’s retrieval shows furnace-repair interest down 13.3% from October 4–10 and 17.0% below the corresponding week in 2025. The pickup did not continue in this observation. Kitchen remodeling was the only core phrase to rise week to week, but its reading remained 18.2% below the year-earlier week.
We calculated those changes within the October 19 retrieval. Search providers can rescale earlier observations, so subtracting this edition’s raw score from a score printed last week would mix measurement versions. The service tables below keep each comparison within one retrieved series.
Dated evidence table
Ten core services
Each phrase has its own normalized 0–100 scale. Read across a row, not down a column: a higher score for roofing than heating does not establish a larger number of searches. All observations are national. Percentage changes use the underlying row values, not the rounded percentages shown here.
| Service phrase | Oct 11–17 | Oct 4–10 | Oct 12–18, 2025 | Weekly change | Year-earlier change |
|---|---|---|---|---|---|
| ac repair | 32 | 35 | 35 | -8.6% | -8.6% |
| bathroom remodel | 62 | 67 | 74 | -7.5% | -16.2% |
| foundation repair | 36 | 46 | 42 | -21.7% | -14.3% |
| furnace repair | 39 | 45 | 47 | -13.3% | -17.0% |
| hvac replacement | 29 | 36 | 30 | -19.4% | -3.3% |
| kitchen remodel | 63 | 61 | 77 | +3.3% | -18.2% |
| roof repair | 61 | 64 | 54 | -4.7% | +13.0% |
| roof replacement | 53 | 59 | 45 | -10.2% | +17.8% |
| water heater replacement | 25 | 26 | 24 | -3.8% | +4.2% |
| window replacement | 43 | 46 | 46 | -6.5% | -6.5% |
Source: Echelon Reports Database, retrieved October 19, 2026. The year-earlier window is exactly 52 weeks earlier. This table measures relative web-search interest, not local demand, advertising costs or booked work.
Four door services, outside the index
Door replacement, entry-door replacement and storm-door installation increased from the preceding week. Only the broad door-replacement phrase also exceeded its year-earlier reading. Entry-door replacement illustrates the risk of treating a weekly rebound as a broad recovery: its score rose from 18 to 21 but remained below the year-earlier score of 47.
| Service phrase | Oct 11–17 | Oct 4–10 | Oct 12–18, 2025 | Weekly change | Year-earlier change |
|---|---|---|---|---|---|
| door replacement | 41 | 40 | 39 | +2.5% | +5.1% |
| entry door replacement | 21 | 18 | 47 | +16.7% | -55.3% |
| storm door installation | 57 | 56 | 71 | +1.8% | -19.7% |
| storm door replacement | 41 | 45 | 48 | -8.9% | -14.6% |
These four phrases remain separate supplemental coverage. Window replacement remains in the original ten-term basket and was not collected again for this supplement. A small normalized value is not evidence of a small local customer pool.
Analysis and counterargument
The useful distinction is between a recent change and a longer comparison. Roofing’s two phrases declined this week, yet both exceeded the corresponding week last year. Bathroom remodeling, furnace repair, foundation repair and HVAC replacement were lower on both comparisons. An owner selling several services should therefore resist describing all of them as one improving or weakening market.
Our analytical read is that roofing owners have a reason to preserve useful acquisition work while checking what happens after the inquiry. That is a narrower recommendation than increasing spending. Separate people seeking a repair from people considering a replacement, then review the estimates, available crews and expected contribution for each group.
The strongest counterargument is that a national roofing comparison may have little relevance to the owner’s territory. Local weather, homeowner research and changes in the mix of searches could influence these readings. Our evidence does not identify the cause. The weather component covers an earlier week, so it cannot explain the October 11–17 search movement.
A local competitor could respond to slower inquiries with a discount, faster appointments or more visible financing. Matching the price would be a poor test if customers are hesitating because an estimate is unclear or the next available appointment is too far away. Treat those explanations as questions for your own records, not findings about competitors we have not examined.
For remodeling and HVAC owners, the same table supports a different starting point. If inquiries are already scarce, inspect local visibility and the offer before assuming a scheduling problem. If inquiries are arriving but not booking, review the response and estimate process before purchasing additional traffic. The national figures help frame the question; the business records decide the action.
Owner decision
Run a two-week review of repair and replacement estimates already in your pipeline. Keep the service area, offer and spending stable while you identify where suitable inquiries stop progressing. Use October 19 through November 1 as the review period, then compare the findings with the preceding two weeks under the same definitions.
The owner or dispatcher should work with the person managing the website and advertising. Use the existing inquiry log, estimate records, appointment calendar and direct job-cost estimates. Record the requested service, broad location, source, response time, estimate outcome and reason given for declining. Do not put customer information into a public worksheet.
| What the records show | First action | Measure through November 1 | Continue, revise or stop |
|---|---|---|---|
| Suitable repair inquiries reach estimates but stall | Review declined estimates and whether the page explains the offered repair | Estimates, bookings, stated objections and expected contribution | Revise the explanation if objections repeat; do not assume more traffic solves it |
| Replacement inquiries fit the business but appointments are unavailable | Check crew capacity and realistic scheduling before expanding promotion | Available slots, quoted dates, cancellations and booked contribution | Preserve profitable work; stop expansion that overloads delivery |
| Suitable inquiries are scarce but estimates convert well | Compare local visibility and relevant competitor offers | Qualified inquiries by service, source and territory | Test one supported local opportunity; national figures alone do not justify spending |
| Bookings fit capacity and cover direct and acquisition costs | Preserve the productive offer and follow-up process | Contribution by service, cancellations and completed collections | Continue while economics hold; revise if contribution falls despite higher volume |
Contribution worksheet
Contribution means the money left after the direct costs of delivering and acquiring the work, before general business overhead. Use actual records or explicitly labeled estimates, not an assumed industry ticket.
| Entry | Roof repair | Roof replacement |
|---|---|---|
| Suitable inquiries within the service area | ____ | ____ |
| Estimates issued and jobs booked | ____ | ____ |
| Expected receipts from those booked jobs | ____ | ____ |
| Direct labor, materials and subcontract costs | ____ | ____ |
| Attributable advertising, handling and review costs | ____ | ____ |
| Expected receipts minus both cost rows | ____ | ____ |
| Crew availability for the promised dates | ____ | ____ |
Keep repair and replacement economics separate. Expected booked value is not completed work or collected cash. Reconcile those amounts when the jobs finish, and track cancellations rather than counting every accepted estimate as permanent revenue.
Continue the existing acquisition approach when suitable bookings cover their direct and acquisition costs and fit available capacity. Revise the request path or estimate explanation when the same obstacle appears repeatedly. Stop an expansion test if its costs consume the expected contribution, if it attracts unsuitable work, or if it displaces better jobs. A small sample is inconclusive, not proof that a new offer works.
This is an analytical recommendation; additional bookings or profit are not guaranteed. It requires staff time and reliable records rather than a new marketing budget.
Next observation
The next search reading should show whether roofing’s weekly decline continues and whether its year-earlier advantage persists. The owner’s review should establish something different: whether repair and replacement inquiries produce acceptable bookings at the current offer and capacity.
If suitable inquiries remain steady while bookings weaken, investigate response, estimates and scheduling. If bookings convert well but suitable inquiries decline, investigate local visibility and competitor offers. If contribution deteriorates while bookings rise, volume is not the success measure. Keep the same service and attribution rules through November 1 so the review answers a consistent question.
Scope method source notes
Complete six-component ERDI
The Echelon Residential Demand Index combines six indicators with equal weight. Its current reading is 92.2. Each component’s 100 means equality with its own stated reference, not one universal seasonal norm. The composite is descriptive context, not a validated forecast of jobs or revenue.[1]
| Component | Index | Observation window | Reference |
|---|---|---|---|
| Search interest | 69.9 | Oct 11–17, 2026 | Median of preceding 52 complete weekly basket readings in this retrieval |
| Existing-home turnover | 100.3 | August 2026 | Mean of original August 2023–2025 releases |
| New-housing permits | 94.9 | August 2026 | Mean of August 2023–2025 observations in current vintage |
| Mortgage financing | 91.6 | Oct 15, 2026 | Corresponding 2023–2025 weekly mean, inverted |
| Weather exposure | 110.7 | Oct 4–10, 2026 | Three-year median of corresponding station-first weeks |
| Matched review counts | 85.6 | Sep 13–Oct 19, 2026 | Sep 6–13 daily rate on the same 929-member cohort |
The composite uses the unrounded components and rounds only the displayed result. Search uses the original ten phrases; the four door phrases do not change that calculation. The method is erdi-six-interval-v1-20261005, with a separate historical series beginning October 5. Earlier ERDI prints retain their original values and are not directly comparable.[1]
Housing and financing dates
The National Association of Realtors’ original August 2026 release reports existing-home sales at a seasonally adjusted annual rate of 3.98 million. This is an annualized pace, not the number sold during August or a new October observation.[13] The reference uses the original August releases for 2023, 2024 and 2025 rather than mixing later revisions.[10][11][12]
The mortgage series reads 7.40% for October 15. The permits series reads 1,403 thousand units at a seasonally adjusted annual rate for August. We retrieved both through FRED on October 19 and preserved their actual observation dates. Permits are a monthly measure; the mortgage series is weekly.[2][3]
Weather window and source
The weather reading uses October 4–10 under the approved maximum-one-week lag. All ten stations supply both daily temperatures for all 70 station-days; each of the three historical comparison weeks also contains 70. The October 11–17 target is incomplete. We used NOAA’s official GHCN daily station archives, retaining their quality flags and converting tenths of Celsius to Fahrenheit before calculation.[4]
The calculation is unchanged: calculate each station’s mean daily temperature from its maximum and minimum, measure its absolute departure from 65°F, average the station departures and sum the week. The reference is the median of the corresponding weeks in the preceding three years. The lag is an operational freshness limit, not evidence that the stations represent every contractor’s territory.[1]
Review-count interval
The review component follows the same 929 matched business identities. From September 13 to October 19, their net review-count change was 5,346 over 36 elapsed days: increases totaled 6,514 and decreases totaled 1,168. The seven-day-equivalent rate was 1.1189 per matched business, against 1.3068 in the September 6–13 reference interval.
That rate divides the net change by 929 businesses and 36 days, then multiplies by seven. It does not reconstruct the intervening weekly path. Reviews can be removed or corrected, and review activity is not completed work. Of the unchanged 965 collection identities, 929 supplied usable matched counts; exclusions were not replaced with zero.
The single reference interval remains provisional rather than a demonstrated seasonal norm. The fixed cohort and original September 6 starting point are preserved. This edition does not estimate regional demand or statewide business populations.[1]
Sources
- [1] Echelon Reports: ERDI methodology
- [2] FRED: 30-year fixed mortgage average
- [3] FRED: housing permits
- [4] NOAA: GHCN daily archive documentation
- [10] NAR: original August 2023 release
- [11] NAR: original August 2024 release
- [12] NAR: original August 2025 release
- [13] NAR: original August 2026 release
Relevant next step
Make the next marketing decision about the work you want
KKS can help examine the service page, local competition and inquiry path for the work you want more of. Start with the service you can fulfill, the territory you actually cover and the inquiry-to-booking figures you already have. A national search comparison is useful context; a local growth decision needs your market and operating constraints.
Discuss your service and market with KKS
Read the previous Echelon Report or review the ERDI methodology.