
Editorial update: October 14, 2026. Original reporting dates are unchanged.
Edition: October 12, 2026. National search observations: October 4–10. Other source windows are stated below.
Finding
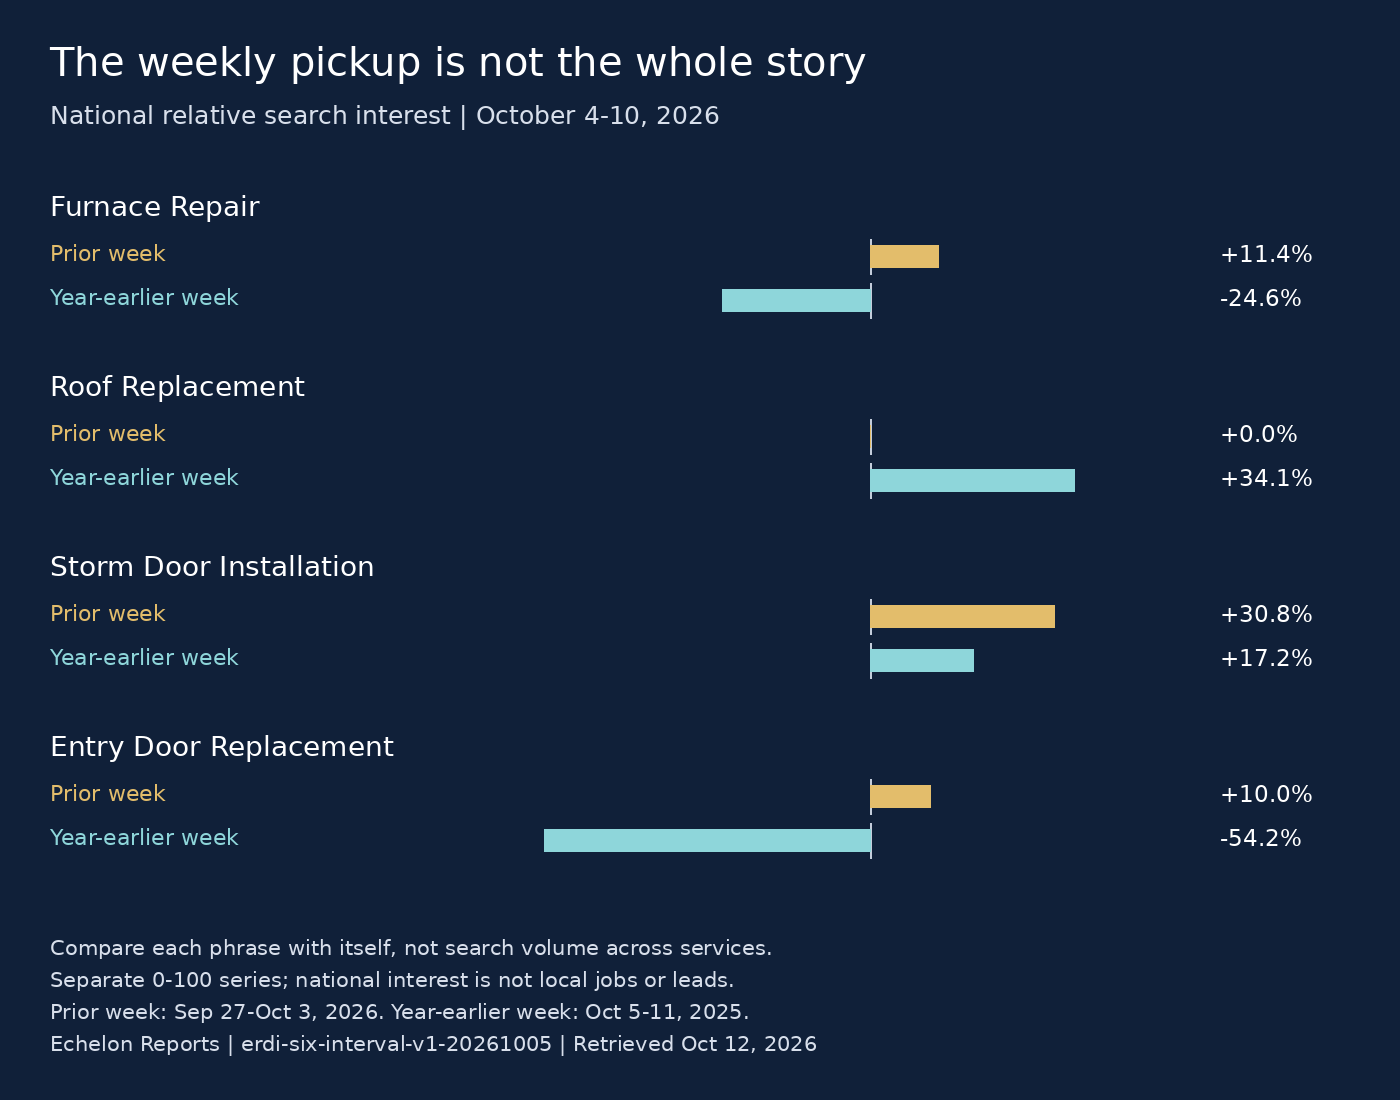
Furnace-repair searches picked up last week, but that is not yet a reason to expand the marketing budget. National relative interest rose 11.4% from the preceding week while remaining 24.6% below the corresponding week last year. An HVAC owner should first check whether suitable local inquiries are turning into profitable bookings.[9]
The recent pickup and the year-earlier gap tell different stories. Neither measures local jobs. Before buying more traffic, a heating contractor can check its furnace-repair page, how it responds to requests and whether appointments are available.
Roofing gives a different signal: roof-replacement interest was unchanged from the prior week and 34.1% above the year-earlier week. In the separate door supplement, storm-door installation rose 30.8% week to week and 17.2% year over year. These differences argue for checking each service separately, not applying one national verdict to everything you sell.[9]
Dated evidence table
Ten core services
Each value below is relative web-search interest on that phrase’s own 0–100 scale, measured in the October 12 retrieval. Compare a row with itself across time. A furnace reading of 49 and a roofing reading of 55 do not establish which service has more searches. Percent changes are calculated from unrounded row values.[9]
| Service phrase | Oct 4–10 | Sep 27–Oct 3 | Oct 5–11, 2025 | Change from prior week | Change from year-earlier week |
|---|---|---|---|---|---|
| ac repair | 38 | 37 | 46 | +2.7% | -17.4% |
| bathroom remodel | 66 | 71 | 67 | -7.0% | -1.5% |
| foundation repair | 44 | 38 | 49 | +15.8% | -10.2% |
| furnace repair | 49 | 44 | 65 | +11.4% | -24.6% |
| hvac replacement | 34 | 33 | 39 | +3.0% | -12.8% |
| kitchen remodel | 60 | 66 | 66 | -9.1% | -9.1% |
| roof repair | 64 | 65 | 52 | -1.5% | +23.1% |
| roof replacement | 55 | 55 | 41 | +0.0% | +34.1% |
| water heater replacement | 26 | 24 | 30 | +8.3% | -13.3% |
| window replacement | 46 | 48 | 47 | -4.2% | -2.1% |
Four door services, outside the index
Window replacement stays in the original ten-term basket above. The four door terms are separate coverage and do not enter the ERDI calculation.[9][10]
| Service phrase | Oct 4–10 | Sep 27–Oct 3 | Oct 5–11, 2025 | Change from prior week | Change from year-earlier week |
|---|---|---|---|---|---|
| door replacement | 40 | 41 | 39 | -2.4% | +2.6% |
| entry door replacement | 22 | 20 | 48 | +10.0% | -54.2% |
| storm door installation | 68 | 52 | 58 | +30.8% | +17.2% |
| storm door replacement | 45 | 39 | 46 | +15.4% | -2.2% |
The year-earlier comparison is exactly 52 weeks earlier, using complete Sunday–Saturday windows. These are national observations, not local search volumes, accepted inquiries or booked work. The comparison uses one retrieval for each phrase; a later pull can rescale earlier values. Do not calculate change by subtracting the raw scores printed in separate editions.[9]
Analysis and counterargument
The heating pickup deserves attention without a spending leap. Furnace-repair interest moved from 44 to 49, against 65 in the year-earlier week. The owner-level question is whether the business can capture and fulfill the calls already arriving, not whether a national percentage justifies more technicians or a larger campaign.[9]
A credible alternative explanation is ordinary seasonal timing or a shift in when cold weather reaches particular markets. Our national search basket cannot separate those causes. Weather observations also lag the search week in this edition, so they cannot establish the cause of the furnace-search pickup.
Other services prevent a broad “repair demand is rising” conclusion. Foundation repair increased 15.8% week to week but remained 10.2% below its year-earlier reading. Bathroom and kitchen remodeling declined from the prior week. Roof-replacement interest held steady and remained above its year-earlier comparison. A contractor’s mix of services can therefore matter more than the direction of a composite.[9]
Door installers face the same distinction. Entry-door replacement rose 10.0% from the previous week but remained 54.2% below its year-earlier reading. Storm-door installation rose in both comparisons; storm-door replacement rose week to week but remained slightly below last year. Before moving money between them, separate actual inquiries, job contribution and installation capacity by service. A low normalized reading is not a count of customers.[9]
Protect the route to profitable jobs and look for the weak step. A competitor may run a promotion or schedule faster during a seasonal pickup. Matching a discount without checking the margin is a different decision from improving your page and response process.
Owner decision
Run a two-week diagnostic for one service you already deliver in one area you already serve. HVAC owners can start with furnace repair; roofers and door installers should use their own service row rather than copy the heating recommendation.
Keep the offer and spending stable unless you find a specific defect. Have the owner or dispatcher review inquiries once a week with whoever manages the website. Record inquiry source, requested service, broad service area, response time, estimate, booking, expected job contribution and available appointment capacity. Keep customer records private.
| What your records show | First action | What to measure over two weeks | Decision at the review |
|---|---|---|---|
| Suitable inquiries arrive but callers cannot reach you or get an appointment | Correct the contact or scheduling problem before buying more traffic | Response time, accepted inquiries, bookings and available slots | Continue if bookings improve without overwhelming fulfillment; revise staffing or scheduling if capacity is the constraint |
| Suitable inquiries reach estimates but rarely book | Review lost-estimate reasons and whether the page explains the actual service clearly | Estimates, booked jobs and stated reasons for declining | Revise the offer or explanation if the same objection recurs; do not label this a traffic shortage |
| Few suitable local inquiries arrive despite an intact contact path | Check local visibility and the existing service page against real local competitors | Qualified inquiries by source and service area | Consider a bounded test only after local evidence supports the target; the national basket alone does not |
| Bookings are profitable and fit available capacity | Preserve the working acquisition route while checking the next source observation | Job contribution after acquisition cost, suitable inquiries and capacity | Continue while the economics hold; do not cut a working service because an unrelated national component is weak |
Profit worksheet
Use actual business records rather than an assumed ticket or conversion rate.
| Entry | Owner’s figure |
|---|---|
| Jobs booked from the reviewed service and source | ____ |
| Expected receipts from those jobs | ____ |
| Direct labor, materials and subcontract costs for those jobs | ____ |
| Marketing, handling and diagnostic costs attributable to those jobs | ____ |
| Expected receipts minus direct job costs minus marketing, handling and diagnostic costs | ____ |
| Available appointment or installation capacity | ____ |
The worksheet estimates contribution after direct job and acquisition costs, not net profit or cash already collected. Reconcile expected amounts to completed jobs and collected receipts afterward.
Continue only when suitable bookings fit capacity and expected job contribution covers acquisition and test costs. Revise or stop if those costs consume the contribution, inquiries fall outside the service area, or the work displaces more profitable jobs. If there are too few inquiries to judge, record an inconclusive result rather than inventing a conversion rate.
This is a recommendation, not a guarantee of more bookings or profit.
Next observation
For the next edition, check whether furnace-repair interest continues to rise and whether the year-earlier gap narrows. For this edition’s owner diagnostic, keep the same service, area and attribution rules through October 25, then reconcile booked work and contribution. Do not treat an extra week of national interest as proof that the business’s own inquiry path improved.
A rise in suitable local inquiries without more bookings would shift attention to response, estimates or capacity. Flat inquiries with healthy conversion would support a local visibility investigation. Falling job contribution would argue against expansion even if inquiries increase.
Scope method source notes
Complete six-component ERDI
| Component | Index | Observation window | Reference |
|---|---|---|---|
| Search interest | 75.9 | October 4–10, 2026 | Median of preceding 52 complete weekly basket readings in this retrieval |
| Existing-home turnover | 100.3 | August 2026 original release | Mean of original August releases for 2023, 2024 and 2025 |
| New-housing permits | 94.9 | August 2026 | Mean of August 2023, 2024 and 2025 in current FRED vintage |
| Mortgage financing | 90.9 | October 8, 2026 | Inverted ratio against corresponding 2023–2025 weeks |
| Weather exposure | 87.2 | September 27–October 3, 2026 | Three-year median of station-first comparable weeks; one-week lag |
| Matched review counts | 78.5 | September 13–October 12, 2026 | September 6–13 daily rate on the same 929-member cohort |
The complete composite is 88.0. Each component receives one-sixth of the weight; the composite uses unrounded values. A reading of 100 means equality with that component’s stated reference. It is not a common seasonal norm, a count of jobs or a validated forecast.[10]
Search covers ten separately normalized national phrases. The four supplemental door phrases do not change the basket or index. Complete-week readings and a fixed comparison basis matter more than a single score.[9][10]
The existing-home turnover component uses limited attributed facts from the National Association of Realtors’ original August releases, not a weekly housing observation or a redistributed dataset. The 2026 release reports 3.98 million at a seasonally adjusted annual rate, a pace rather than actual sales in one month.[16]
The reference uses the original 2023–2025 August releases rather than mixing later revisions.[13][14][15]
The current turnover release is dated September 10, 2026. Its facts remain monthly context for this edition, not newly observed October sales.[16]
FRED supplies the financing and permit observations. The mortgage series reads 7.40% for October 8. Permits read 1,403 thousand at a seasonally adjusted annual rate for August. Both archives were retrieved October 12; the observation dates did not change because we downloaded them again.[6][7]
The weather target, October 4–10, has 40 of the required 70 station-days. The immediately preceding week, September 27–October 3, has all 70 across the ten approved stations and qualifies under the maximum-one-week lag policy. The three comparison weeks also have 70 station-days each. The measure averages station-level temperature departures before comparison; it does not establish a local forecast or attribute the search changes to weather.[17][10]
The review component preserves the same 929-member, identity-matched cohort and September 6 starting point. Between September 13 and October 12, its net review-count change was 3,948 over 29 elapsed days: positive changes totaled 5,052 and negative changes totaled 1,104. The current seven-day-equivalent rate is 1.0258 per matched member, compared with 1.3068 in the single September 6–13 reference interval. That is an interval average, not reconstructed weekly history. Reviews can be removed or corrected; none of these counts measures completed jobs.[10]
The October 12 collection attempted the unchanged 965-member roster. Thirty-six observations failed usable count or identity checks and were excluded, not filled with zero. The qualified cohort digest matches the accepted method. One reference interval remains a provisional descriptive comparison, not a demonstrated seasonal norm.[10]
Method: erdi-six-interval-v1-20261005. The method adopted October 5 starts a separate series from earlier ERDI versions. Historical prints retain their original scope and values. No regional index, local demand estimate or company census is asserted here. The current method and its source-specific comparisons are described on the methodology page.[10]
Sources
The service readings and percentage changes are Echelon calculations from the retained October 12 search responses. Source 9 explains how the search data is normalized; it does not publish this edition’s numerical observations. The tables above show those dated observations. The methodology link explains the six-component calculation.
- [6] https://fred.stlouisfed.org/series/MORTGAGE30US
- [7] https://fred.stlouisfed.org/series/PERMIT
- [9] https://docs.dataforseo.com/v3/keywords_data-google_trends-overview
- [10] https://echelonreports.com/erdi-methodology
- [13] https://www.globenewswire.com/news-release/2023/09/21/2747405/0/en/existing-home-sales-decreased-0-7-in-august.html
- [14] https://www.globenewswire.com/news-release/2024/09/19/2949128/0/en/Existing-Home-Sales-Dipped-2-5-in-August.html
- [15] https://www.globenewswire.com/news-release/2025/09/25/3156407/0/en/NAR-Existing-Home-Sales-Report-Shows-0-2-Decrease-in-August.html
- [16] https://www.globenewswire.com/news-release/2026/09/10/3359670/0/en/nar-existing-home-sales-report-shows-2-0-decrease-in-august.html
- [17] https://www.ncei.noaa.gov/cdo-web
Relevant next step
Check the service that should produce your next profitable job
If suitable local inquiries are weak, KKS can help examine the service page, local competition and contact path before proposing more spending. Bring the service you want to grow, the area you can cover and your recent inquiry-to-booking record.